Simple Models of Climate Change
What determines the climate? Explanations proliferated — models for climate built out of little more than basic physics, a few equations aided by hand-waving. All began with a traditional picture of a stable system, self-regulated by natural feedbacks. A few nineteenth-century scientists suggested that a change in the level of carbon dioxide gas might cause an ice age or global warming, but most scientists thought the gas could not possibly have such effects. Yet climate did change, as proven by past ice ages. Some pointed out that feedbacks did not necessarily bring stability: in particular, changes in snow cover might amplify rather than dampen a climate shift. In the 1950s, an ingenious (although faulty) model involving changes in the Arctic Ocean suggested a disturbing possibility of arbitrary shifts. Experiments with fluids made that more plausible. Apparently the interlinked system of atmosphere, ice sheets, and oceans could swing in regular cycles or even in random jerks. Worse, around 1970 highly simplified computer models raised the specter of a catastrophic climate runaway. In the 1980s, the center of research shifted to large and complex computer models. These did not show a runaway, but reinforced what many simpler models had been suggesting: the next century would probably see significant greenhouse warming. In a parallel development, studies of climates in the distant past offered an independent way to study how climates work. By 2020 the analogy of ancient climates had become roughly as useful as the increasingly complicated computer calculations for answering some basic questions. Other simple models remained useful for exploring important questions that the giant computer models could not handle efficiently
(Basic general greenhouse effect ideas and observations are covered in the core essay on The Carbon Dioxide Greenhouse Effect. Technical calculations on how radiation and heat move through levels of the atmosphere are described in a supplementary essay on Basic Radiation Calculations. For the large-scale computer work, see the essay on General Circulation Models of the Atmosphere.)
| "This is a difficult subject: by long tradition the happy hunting ground for robust speculation,
it suffers much because so few can separate fact from fancy." — G.S. Callendar(1) |
| "Meteorology is a branch of physics," a weather expert remarked in 1939, "and physics makes use of two powerful tools: experiment and mathematics. The first of these tools is denied to the meteorologist and the second does not prove of much use to him in climatological problems." So many interrelated factors affected climate, he explained, that you couldn't write it all down mathematically without making so many simplifying assumptions that the result would never match reality. It wasn't even possible to calculate from first principles the average temperature of a place, let alone how the temperature might change in future years. And "without numerical values our deductions are only opinions."(2) | - LINKS - | |
| That didn't stop people from putting forth explanations of climate change. A scientist would come up with an idea about how certain factors worked and explain it all in a page or two, helped along by some waving of hands. Some scientists went on to build a few equations and calculate a few numbers. At best they could show only that the factors they invoked could have effects of roughly the right magnitude. There was no way to prove that some other explanation, perhaps not yet thought of, would not work better. These mostly qualitative "theories" (in fact, merely plausible stories) were all anyone had to offer until digital computers came into their own, late in the 20th century. Until then, the climate community had good reason to keep theory at arms' length. Even those who tried to think in general physical terms hesitated to call themselves "theorists," an almost pejorative term in meteorology. |
More discussion in |
|
| The science did have a foundation, at least potentially, in simple ideas based on undeniable physical principles. The structures that scientists tried to build on these principles were often called "models" rather than "theories." Sometimes that was just an attempt to hide uncertainty (a paleontologist complained that "'model'... is just a word for people who cannot spell 'hypothesis'").(3) But calling a structure of ideas a "model" did emphasize the scientist's desire to deal with a simplified system that one could almost physically construct on a workbench — something that embodied a hands-on feeling for processes. The great trick of science is that you don't have to understand everything at once. Scientists are not like the people who have to make decisions in, say, business or politics. Scientists can pare down a system into something so simple that they have a chance to understand it. | ||
| Basic Ideas, Right and Wrong TOP OF PAGE | ||
| The first job of a model was to explain, however crudely, the world's climates as presently seen in all their variety. After all, the main business of climatologists until the mid-20th century was the simple drudgery of compiling statistics. Knowledge of average and extreme temperatures and rainfall and the like was important to farmers, civil engineers, and others in their practical affairs — never mind guessing at explanations. But people could not resist trying to explain the numbers. A textbook would start off with the main factor, the way sunlight and thus warmth varies with latitude (perhaps with some calculations and charts). There would follow sections on the prevailing winds that brought rain, and how mountain ranges and ocean currents could affect the winds, and so forth. It was all soundly based on elementary physics. It was a dry exercise, however, not so much a theory of climate as a static regional description.(4) |
|
|
| Asked about changes in climate, most climatologists at mid-century would think of the extremes that people should plan for — the worst heat wave to be expected or the "hundred-year flood." If there was any pattern to such changes, experts believed it would be cyclical. Rather than try to build a physical theory, those who took any interest in the question mostly looked to numerical studies. Perhaps eventually someone would find correlations that pointed to a simple physical explanation. The varying number of sunspots, for example, might signal changes in the Sun that correlated with climate cycles. |
|
|
| The simplest and most widely accepted model of climate change was self-regulation, which meant that changes were only temporary excursions from some natural equilibrium. Through the first half of the 20th century, textbooks of climatology treated climate in a basically static fashion. The word "climate" itself was defined as the long-term average weather conditions, the stable point around which annual temperature and rainfall fluctuated.(5*) After all, in their records of reliable observations the meteorologists found only minor fluctuations from decade to decade. These records went back less than a century, but they supposed that one century was much like the next (aside from changes that took place over many thousands of years, like the ice ages, which were themselves seen as excursions from the very long-term average). Climatologists expanded this idea into a "doctrine," as one critic called it, "that the present causes of climatic instability are not competent to produce anything more than temporary variations, which disappear within a few years."(6) A leading climatologist put it straightforwardly in 1946: "We can safely accept the past performance as an adequate guide for the future."(7) |
|
|
| Almost everyone believed in the natural world's propensity to automatically compensate for change in a self-sustaining "balance." If climate ever diverged toward an extreme, before long it would restore itself to its "normal" state. As evidence, the atmosphere had not changed — or at least not extremely radically — over the past half-billion years.(8) And scientists came up with plausible regulating mechanisms (some of them are described below). The approach expressed a generally sound intuition about the nature of climate as a process governed by a complex set of interactions, all feeding back on one another. But romantic views that stability was guaranteed by the suprahuman, benevolent power of Nature gave a false confidence that every feature of our environment would stay within limits suitable for human civilization. Issues of complexity and stability in the social structure of climate science are explored in a supplementary essay on Climatology as a Profession. |
|
|
| Of course, there was abundant historical evidence of variations lasting a few decades or centuries, random swings or (as some thought) regular cycles. Perhaps periods of drought like the American Dust Bowl of the 1930s recurred on some schedule, or perhaps not. Far more impressive were the ice ages of the past few million years, undeniable proof that climate could change enormously. Looking farther back, geologists found evidence of much earlier ice ages, including traces of massive glaciation near the equator. On the other hand, already in the 18th century fossils of tropical species such as crocodiles had been found in the environs of Paris, and by the early 20th century fossils of tropical plants were discovered even in Antarctica. Early explanations included a general cooling of the planet over millions of years from an early fiery birth, or shifts of Earth's axis of rotation that changed the location of the poles. Understanding these grand climate swings posed a fascinating scientific puzzle, with no apparent practical value whatsoever | ||
| Elementary Physics (19th century) TOP OF PAGE | ||
| "As a dam built across a river causes a local deepening of the stream, so our atmosphere, thrown as a barrier across the terrestrial rays, produces a local heightening of the temperature at the Earth's surface." Thus in 1862 John Tyndall described the key to climate change. He had discovered in his laboratory that certain gases, including water vapor and carbon dioxide ( CO2), are opaque to heat rays. He understood that such gases high in the air help keep our planet warm by interfering with escaping radiation.(9) | ||
| This kind of intuitive physical reasoning had already appeared in the earliest speculations on how atmospheric composition could affect climate. In the 1820s a French mathematician-physicist, Joseph Fourier, asked himself a deceptively simple question: why is the Arctic so cold on a winter night? He realized that infrared radiation, discovered in 1800, was carrying heat energy away into space. He concluded that the void between the planets must be colder than the Arctic (it's actually far colder). Then why doesn't the entire night side of the planet radiate away its heat and freeze over every night? Fourier realized that it is the atmosphere that keeps Earth warm, by allowing visible sunlight in to heat the surface while blocking heat radiation from escaping. (Much later, after physicists discovered the laws of radiation, calculation showed that an airless rock at Earth's distance from the Sun would indeed be well below freezing temperature.)(10*) |
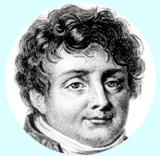 Joseph Fourier CLICK FOR FULL IMAGE |
|
| Fourier tried to explain his insight with an analogy, comparing Earth in its envelope of air to a box with a glass cover. Such boxes were a popular scientific gadget, warming up when set in sunlight. The analogy was too simple, for as Fourier knew, the main effect of the glass is to keep the air, after it is heated by contact with sun-warmed surfaces, from wafting away. Nevertheless the pane-of-glass analogy stuck; trapping of heat by the atmosphere eventually came to be called the "greenhouse effect." Already in 1681 an earlier French scientist, Edme Mariotte, had noted that you cannot feel the heat of a fire through a sheet of transparent glass; Fourier's bold step was to propose that insubstantial air can act the same way.(11*) |
|
|
| Not until the mid-20th century would scientists fully grasp, and calculate with some precision, just how the effect works. A rough explanation goes like this. Visible sunlight penetrates easily through the air and warms the Earth’s surface. When the surface emits invisible infrared heat radiation, this radiation easily penetrates nitrogen and oxygen gas, the main constituents of the air. But as Tyndall found, even a trace of CO2 or water vapor, no more than it took to fill a bottle in his laboratory, is almost opaque to heat radiation. Thus a good part of the radiation that rises from the surface is absorbed by these gases in the middle levels of the atmosphere. Its energy transfers into the air itself rather than escaping directly into space. Not only is the air thus warmed, but also some of the energy detained there is radiated back to the surface, warming it further. |
|
|
| That’s a shorthand way of explaining the greenhouse effect — seeing it from below. Unfortunately, shorthand arguments can be misleading if you push them too far. Fourier, Tyndall and most other scientists for nearly a century used this approach, looking at warming from ground level, so to speak, asking about the radiation that reaches and leaves the surface of the Earth. So they tended to think of the atmosphere overhead as a unit, as if it were indeed a simple pane of glass like one in a greenhouse. But this is not how global warming actually works, if you look at the process in detail. | ||
| What happens to infrared radiation emitted by the Earth's surface? As it moves up layer by layer through the atmosphere, some is stopped in each layer. (To be specific: a molecule of carbon dioxide, water vapor or some other greenhouse gas absorbs a bit of energy from the radiation. The molecule may radiate the energy back out again in a random direction. Or it may transfer the energy into velocity in collisions with other air molecules, so that the layer of air where it sits gets warmer.) The layer of air radiates some of the energy it has absorbed back toward the ground, and some upwards to higher layers. As you go higher, the atmosphere gets thinner and colder. Eventually the energy reaches a layer so thin that radiation can escape into space. | ||
| What happens if we add more carbon dioxide? In the layers so high and thin that much of the heat radiation from lower down slips through, adding more greenhouse gas means the layer will absorb more of the rays. So the place from which part of the heat energy finally leaves the Earth will shift to higher layers. Those are thinner and colder layers, so they do not radiate heat as efficiently.(11a*) The planet as a whole is now taking in more energy than it radiates (which is in fact our current situation). As the upper levels radiate some of the excess downwards, all the lower levels down to the surface warm up. The imbalance must continue until the upper levels get warmer and radiate out more energy. As in Tyndall's analogy of a dam on a river, the barrier thrown across the outgoing radiation forces the level of temperature everywhere beneath it to rise until there is enough radiation pushing out to balance what the Sun sends in. | ||
| While that may sound fairly simple once it is explained, the process is not obvious if you have started by thinking of the atmosphere from below as a single slab. The correct way of thinking eluded nearly all scientists for more than a century after Fourier. Physicists learned only gradually how to describe the greenhouse effect. To do so, they had to make detailed calculations of a variety of processes in each layer of the atmosphere, such as convection (the transfer of heat by rising columns of air). (For more on absorption of infrared by gas molecules, see this discussion in the essay on Basic Radiation Calculations and this endnote) |
|
|
| Despite Fourier's exceptional prowess in mathematics and physics, he lacked the knowledge to make even the simplest numerical calculation of how radiation is absorbed in the atmosphere.(12*) A few other 19th-century scientists attempted crude calculations and confirmed that at the Earth’s distance from the Sun, our planet would be frozen and lifeless without its blanket of air.(13) Tyndall followed with rich Victorian prose, arguing that water vapor "is a blanket more necessary to the vegetable life of England than clothing is to man. Remove for a single summer-night the aqueous vapour from the air... and the sun would rise upon an island held fast in the iron grip of frost."(14) Tyndall needed no equations, but only simple logic, to see what many since him overlooked: it is at night that the gases are most important in blocking heat radiation from escape, so it is night-time temperatures that the greenhouse effect raises the most. |
|
|
| Arrhenius: Carbon Dioxide as Control Knob
TOP OF PAGE |
||
| These elementary ideas were developed much further by the Swedish physical chemist Svante Arrhenius, in his pioneering 1896 study of how changes in the amount of CO2 may affect climate. Following the same line of reasoning as Tyndall, Arrhenius pointed out that an increase in the blocking of heat radiation would make for a smaller temperature difference between summer and winter and between the tropics and the poles. |
|
|
| Arrhenius's model used an "energy budget," getting temperatures by adding up how much solar energy was received, absorbed, and reflected. This resembled what his predecessors had done with less precise physics. But Arrhenius's equations went well beyond that by taking into account another physical concept, elementary but subtle, and essential for modeling real climate change. This was what one turn-of-the-century textbook called "the mutual reaction of the physical conditions" — today we would call it "feedback."(15) | ||
| An early example had been worked out by James Croll, a self-taught British scientist who had worked as a janitor and clerk in institutions where he could be near the books he needed to develop his theory of the ice ages. Croll noted how the ice sheets themselves would influence climate. When snow and ice had covered a region, they would reflect most of the sunlight back into space. Sunlight would warm bare, dark soil and trees, but a snowy region would tend to remain cool. If India were somehow covered with ice (or anything white), its summers would be colder than England's. Croll further argued that when a region became cooler, the pattern of winds would change, which would in turn change ocean currents, perhaps removing more heat from the region. Once something started an ice age, the pattern could become self-sustaining.(16) | ||
| Arrhenius stripped this down to the simple idea that a drop of temperature in an Arctic region could mean that some of the ground that had been bare in summer would become covered with snow year-round. With less of the dark tundra exposed, the region would have a higher "albedo" (reflectivity), that is, the ground would reflect more sunlight away from the Earth. That would lower the temperature still more, leaving more snow on the ground, which would reflect more sunlight, and so on. This kind of amplifying cycle would today be called "positive feedback" (in contrast to "negative feedback," a reaction that acts to hold back a change). Such a cycle, Arrhenius suggested, could turn minor cooling into an ice age. These processes, however, were far beyond his power to calculate; it would be a big enough job to find the immediate effect of a change in CO2. One interesting conclusion was that the warming effect would be amplified in the Arctic, compared with lower latitudes—a disproportionate heating that would eventually turn out to be one of the most visible and damaging early signs of greenhouse global warming. | ||
| Arrhenius showed his physical insight at its best when he realized that he could not set aside another simple feedback, one that would immediately and crucially exaggerate the influence of any change. Warmer air would hold more moisture. Since water vapor is itself a greenhouse gas, the increase of water vapor in the atmosphere would augment the temperature rise. Arrhenius therefore built into his model an assumption that the amount of water vapor contained in the air would rise or fall with temperature. He supposed this would happen in such a way that relative humidity would remain constant. That oversimplified the actual changes in water vapor, but made it possible for Arrhenius to roughly incorporate the feedback into his calculations. The basic idea was sound. The consequences of adding CO2 and warming the planet a bit would indeed be amplified because warmer air held more water vapor. In a sense, raising or lowering CO2 acted mainly as a throttle to raise or lower the really important greenhouse gas, H2O. | ||
| Then why pay attention at all to CO2, when water was far more abundant? Although Arrhenius understood the answer intuitively, it would take a century for it to be explained in thoroughly straightforward language and confirmed as a central feature of even the most elaborate computer models. The answer, in brief, is that the Earth is a wet planet. Water cycles in and out of the air, oceans, and soils in a matter of days, exquisitely sensitive to fluctuations in temperature. By contrast CO2 lingers in the atmosphere for centuries. So the gas acts as a "control knob" that sets the level of water vapor. If all the CO2 were somehow removed, the temperature at first would fall only a little. But then less water would evaporate into the air, and some would fall as rain. With less water vapor, the air would cool further, bringing more rain... and then snow. Within weeks, the air would be entirely dry and the Earth would settle into the frozen state that Fourier and Tyndall had pictured for a planet with no greenhouse gases.(16a) |
|
|
| It was no simple matter to calculate how changing the level of CO2 would alter radiation and thus surface temperature, and how that would in turn affect the level of water vapor, and how that would bring a further cascade of changes until the atmosphere reached a new equilibrium. A calculation was only possible because an American scientist, Samuel P. Langley, had recently published ingenious measurements of the atmospheric absorption of infrared radiation. He had invented a sensitive detector and used it to measure heat rays coming from the moon at different angles through the atmosphere. Recording the local humidity each time, Langley and a collaborator had worked out how much radiation water vapor blocked. | ||
| The numerical computations cost Arrhenius month after month of laborious pencil work as he estimated the energy balance for each zone of latitude. He may have persevered in the massive task as an escape from melancholy, for his wife had left him along with their baby boy and a divorce was underway. In retrospect, the massive computation could hardly be justified scientifically, given the large uncertainties in the available data (in particular, the details of how the atmosphere absorbs radiation in different regions of the infrared spectrum were largely unknown). Moreover, his model was crude, neglecting a variety of important effects. Nevertheless he came up with numbers that he published with some confidence.(17) |  Arrhenius |
|
| "I should certainly not have undertaken these tedious calculations," Arrhenius wrote, "if an extraordinary interest had not been connected with them."(18) The prize sought by Arrhenius was the solution to the riddle of the ice ages. He focused on a decrease in CO2 as a possible cause of cooling, and found that cutting the level in half could indeed bring an ice age. But he also took the trouble to estimate what might happen if the amount of gas in the atmosphere, at some distant time in the past or future, was double its present value. He computed that would bring roughly 5 or 6 °C of global warming. |
|
|
| This result is not far from the range that scientists would compute a century later using vastly better models; the current estimate is that a doubling of CO2 will bring some 3 degrees of warming, give or take a degree or two. Did Arrhenius end up in the same range by sheer luck? Yes and no. Arrhenius had made his name (and eventually won a Nobel Prize) with brief and straightforward physics and chemistry calculations, the sort that must come out roughly right if you start with decent data. Langley's numbers for absorption were not too far off, and Arrhenius included the most obvious physical forces. | ||
| But climate is not a simple physical system. A true calculation of greenhouse effect warming requires measurements far more accurate and far more complete than Langley's. The details of exactly what bands of radiation are absorbed by CO2 and water molecules might have happened to be arranged so as to produce a markedly higher or lower amount of warming. As for theory, Arrhenius's model planet was mostly static. He deliberately left aside factors he could not calculate, such as the way cloudiness might change over the real Earth when the temperature rose. He left aside the huge quantities of heat carried from the tropics to the poles by atmospheric movements and ocean currents, which also might well change when the climate changed. Most important, he left aside the way updrafts would carry heat from a warmer surface into the upper atmosphere. In 1963, when a scientist made a calculation roughly similar to Arrhenius's, but with the aid of improved data on the absorption of radiation and an electronic computer, he found a far greater greenhouse warming — indeed impossibly greater. The assumptions left out too much that was necessary to get a valid answer.(19*) | ||
| Yet Arrhenius understood that he had not overlooked any terribly potent effect. Calculations aside, since the atmosphere keeps the surface of the Earth warm — in fact, roughly 40°C warmer than a bare rock at the same distance from the Sun — a few degrees sounded like about the right effect for a change in the atmosphere that modestly altered the balance of radiation. Arrhenius also knew that in past geological ages the Earth’s climate had in fact undergone changes of a few degrees up or down, not many tens of degrees nor mere tenths of a degree. While neither Arrhenius nor anyone for the next half-century had the tools to show what an increase of CO2 would really do to climate, he had given a momentous demonstration of what it could possibly do. |
|
|
| Chamberlin and the Carbon System TOP OF PAGE | ||
| A crude idea of how the amount of CO2 could affect radiation was only the first half of a calculation of global warming. The other half would be a model for figuring how the amount of CO2 itself might change. A colleague of Arrhenius, Arvid Högbom, had already published some preliminary ideas. Arrhenius's 1896 paper stimulated an American geologist and bold thinker, Thomas C. Chamberlin, to look into the planet's carbon system more deeply. In 1897 he published "a paper which, I am painfully aware, is very speculative..." The speculations revolved around the great puzzle of the ice ages. Chamberlin later remarked how ice ages were "intimately associated with a long chain of other phenomena to which at first they appeared to have no relationship." He was the first to demonstrate that the only way to understand climate change was to understand almost everything about the planet together — not just the air but the oceans, the volcanoes bringing gases from the deep interior, the chemistry of how minerals gradually disintegrated under weathering, and more. | ||
| Chamberlin's novel hypothesis was that ice ages might follow a self-oscillating cycle driven by feedbacks involving CO2. Drawing on Arrhenius's intuition, Chamberlin explained clearly how the gas acts as the long-term regulator of the daily atmospheric fluctuations of water vapor. CO2, he noted, was injected into the atmosphere in spates of volcanic activity. It was gradually withdrawn as it combined with minerals during the weathering of rocks and soil. If the volcanic activity faltered, then as minerals slowly leached the gas out of the atmosphere, the planet would cool. Feedbacks could make a temporary dip spiral into a self-reinforcing decline. For one thing, as the land cooled, bogs and the like would decompose more slowly, which meant they would lock up carbon in frozen peat, further lowering the amount of CO2 in the air. Moreover, as the oceans cooled, they too would take up the gas — warm water evaporates a gas out, cold water absorbs it. The process would stop by itself once ice sheets spread across the land, for there would then be less exposed rock and bogs taking up CO2. Reversing the process could bring a warming cycle.(20) |
|
|
| Chamberlin seemed only to be adding to the tall pile of speculations about ice ages, but along the way he had pioneered the modeling of global movements of carbon. He made rough calculations of how much carbon was stored up in rocks, oceans, and organic reservoirs such as forests. He went on to point out that compared with these stockpiles, the atmosphere contained only a minor fraction — and most of that CO2 cycled in and out of the atmosphere every few thousand years. It was a delicate balance, he warned. Climate conditions "congenial to life" might be short-lived on geological time scales. Chamberlin quickly added that "This threat of disaster is not, however, a scientific argument..." He was offering the idea more for its value "in awakening interest and neutralizing inherited prejudice," namely, the assumption that the atmosphere is stable.(21) |
|
|
| A Fundamentally Stable System? TOP OF PAGE | ||
| Other scientists were not awakened. While some admitted that geological processes could alter the CO2 concentration, on any time scale less than millions of years the atmosphere seemed to be unchanging and unchangeable. After all, nearly all of the carbon in Chamberlin’s system was locked up in seawater and minerals. Any emissions humans might produce seemed a negligible addition. | ||
| The CO2 model, "recommended to us by the brilliant advocacy and high authority of Prof. T.C. Chamberlin," did briefly become a popular theory to explain the ice ages and other slow climate changes of the past — better known, in fact, than Arrhenius's complicated calculation. But within a few years scientists dismissed the entire theory for what seemed insuperable problems.(22) | ||
| According to a simple experiment, there was already enough CO2 in the air so that its effect on infrared radiation was "saturated" — meaning that all the radiation that the gas could block was already being absorbed, so that adding more gas could make little difference. Moreover, water vapor also absorbed heat rays, and water was enormously more abundant in the atmosphere than CO2. How could adding CO2 affect radiation in parts of the spectrum that H2O (not to mention the CO2 itself) already entirely blocked? |
|
|
| These studies with the crude techniques of the early 20th century were inaccurate. Modern measurements show that even in the parts of the infrared spectrum where water vapor and CO2 are effective, only a fraction of the heat radiation emitted from the surface of the Earth is blocked before it escapes into space. And that is beside the point anyway. The greenhouse process works regardless of whether the passage of radiation is saturated in lower layers. As explained above, the energy received at the Earth's surface must eventually work its way back up to the higher layers where radiation does slip out easily (in the language of physics, this is the side "wings" of the absorption spectrum, where the gas only partially blocks radiation). Adding some greenhouse gas to those high, thin layers must warm the planet no matter what happens lower down. |
|
|
| This had been described correctly already in 1901: "radiation from the earth into space does not go directly from the ground," Nils Ekholm explained, "but on the average from a layer of the atmosphere having a considerable height above sea-level... The greater is the absorbing power of the air for heat rays emitted from the ground, the higher will that layer be. But the higher the layer, the lower is its temperature relatively to the ground; and as the radiation from the layer into space is the less the lower its temperature is, it follows that the ground will be hotter the higher the radiating layer is."(22a) |
|
|
| Ekholm's explanation was published in a leading meteorological journal, yet it was almost entirely overlooked. Through the first half of the 20th century, hardly any of the few scientists who took an interest in the topic thought in this fashion. They were convinced by the subtly flawed viewpoint that looked at the atmosphere as a single slab. Even Chamberlin concluded that Arrhenius had failed to get his physics right, remarking to a colleague, "I greatly regret that I was among the early victims of Arrhenius' error." After all, was it reasonable to imagine that humans could alter something as grand as the world's climate by changing a tiny fraction of the atmosphere’s content? The notion clashed with common ideas that everyone found persuasive. Confident that the climate was self-regulating on any human timescale, scientists readily dismissed Arrhenius’s peculiar speculation about global warming from fossil fuels. |
|
|
| While most people thought it was obvious from everyday observation that the climate was self-regulating, scientists had not identified the mechanisms of regulation. They had several to choose from. | ||
| Through the first half of the 20th century, one common objection to the idea of a future global warming was that only a little of the CO2 on the planet's surface was in the air. Vastly more was locked up in seawater, in equilibrium with the gas in the atmosphere. The oceans would absorb any excess from the atmosphere, or evaporate gas to fill out any deficiency. This was a main reason for dismissing Arrhenius's speculation about future global warming: the relatively puny byproducts of human industry would no doubt be dissolved in the oceans as fast as they were emitted. (In fact, at the rate industry was producing CO2 around 1900 that was a reasonable guess.) "The sea acts as a vast equalizer," as one scientist wrote, making sure all fluctuations "are ironed out and moderated."(23) | <=The oceans |
|
| If the oceans somehow failed to stabilize the system, there was another large reservoir of carbon stored up in organic matter such as forests and peat bogs. That too seemed likely to provide what one scientist called "homeostatic regulation."(24) For if more CO2 entered the atmosphere, it would act as fertilizer to help plants grow more lushly, and this would lock up the excess carbon in soil and other organic reservoirs. | ||
| Beginning in the 1950s, a few scientists attempted to work out real numbers to check the idea. They constructed primitive models representing the total carbon contained in an ocean layer, in the air, in vegetation, and so forth, with elementary equations for the fluxes of carbon between these reservoirs. These were only one of a number of "bookkeeping" studies, begun early in the century and increasingly common by the 1950s, that added up the entire atmosphere's stock of heat, energy, and various chemicals. The implicit aim was to balance each budget in an assumed equilibrium.(25) There was little solid data for any of these things, least of all the biological effects. Scientists could easily adjust numbers until their models showed self-stabilization by way of CO2 fertilization, as expected. |
|
|
| Regardless of the CO2 budget, scientists expected other feedbacks would regulate the world's temperature. In particular, any increase of temperature would allow the air to hold more moisture, where it would create more clouds, which would reflect sunlight away, moderating the heat and doubtless restoring the equilibrium. Such was the view of no less an authority than the President of the Royal Meteorological Society, Sir George Simpson, K.C.B., F.R.S. In 1939 he explained that "the change in the cloud amount is the predominating factor in the regulation of the temperature of the atmosphere. The atmosphere appears to act as a great thermostat, keeping the temperature nearly constant by changing the amount of cloud."(26*) That was about as simple as a physical model could get. | ||
| Many Sorts of Models (1900-1930s) TOP OF PAGE | ||
| Yet climates had undoubtedly changed in the past, and slightly more complicated models were needed to explain that. The most widely accepted style of explanation invoked altered "weather patterns." The atmosphere could shift to a different arrangement of winds, lasting decades or perhaps centuries, with different storm tracks and precipitation. Such changes could plausibly be caused by slow geological movements. The raising or lowering of a mountain range would obviously alter winds and temperatures, and opening or closing a strait would of course redirect ocean currents.(27) Perhaps changes of geography were all that geologists needed to explain the major climate changes in the Earth's history. |
|
|
| These changes would be mostly regional, not global, but many experts thought of climate changes as mostly local affairs in any case. This view was in line with the traditional climatology that explained the current distribution of deserts, rainforests, and ice caps in terms of the location of mountain ranges and warm or cold ocean currents. It was only necessary to take the reasoning about prevailing winds, the tracks followed by storms, and so forth, and apply it to a different geography. The result was what one expert described as "a large amount of literature which is both geological and meteorological."(28) |
|
|
| Through the first half of the 20th century, scientific theories on climate change continued to revolve mainly around attempts to explain the ice ages. The explanations by geological rearrangements remained the favorite type of theory, "never seriously challenged," as one authority said in 1922.(29) On the other hand, nobody ever made these explanations precise, and they remained more a kind of story-telling than useful science. | ||
| An important example of work on the topic was an idea developed by the meteorologist Alfred Wegener in the 1920s. It happened that Wegener loved geology as much as meteorology (he was also dedicated to studies in Greenland, where he disappeared on an expedition in his fiftieth year). In collaboration with another meteorologist, Wladimir Köppen, Wegener worked through the geological evidence of radical climate change. Traces of ancient ice caps were found in rock beds near the equator, and fossils of tropical plants in rocks near the poles. Wegener hoped to resolve the puzzle with his controversial claim that continents drifted about from tropics to Arctic and back. Along the way the two meteorologists worked out a climate change theory. | ||
| They started off from Arrhenius's idea that the key variable, albedo, depended on whether snow melted or persisted through the summer. The great sheets of ice that reflected away sunlight could persist only if they rested on land, not ocean. So the authors figured that the recent epoch of ice ages had begun when the North Pole wandered over Greenland, and ice ages had ceased once it moved on into the Arctic Ocean. | ||
| Wegener and Köppen went into further detail using a theory that had been hanging around since the 19th century. Croll had suggested that ice ages could be linked with regular cycles in the Earth's orbit, the kind of thing astronomers computed. Over many centuries these shifts caused minor variations in the amount of sunlight that reached a given latitude on the Earth. The variations gave rise to ice ages, Croll argued, whenever enfeebled sunlight allowed excess snow accumulation. In the 1920s a Serbian engineer, Milutin Milankovitch, began to develop these astronomical calculations and plugged them into equations that simulated the global climate. His energy budget model was like Arrhenius's, but paid closer attention to how much sunlight was received at each latitude in each season, and what that would mean for ice and snow. Milankovitch found that it was summers with weaker sunlight, in other words colder summers, that counted for keeping the reflective snow in place — not cold winters, as Croll had supposed. Wegener and Köppen took up these ideas, insisting that they were "nearly self-evident, and yet contested by some authors!"(30) |
|
|
| From then on, everyone who worked on climate change took into account possible changes in albedo due to ice and snow in northern latitudes. For example, when G.S. Callendar took up the question of greenhouse warming in 1938, in a discussion at a meeting of the Royal Meteorological Society he noted that in recent decades temperatures had been rising noticeably in the Arctic. That led him to suggest cryptically that an increase of CO2 might be acting "as a promoter to start a series of imminent changes in the northern ice conditions."(31) |
|
|
| Some experts offered more specific elaboration, backed up by a few primitive calculations. The most striking came from a respected British scientist, C.E.P. Brooks. He argued that once an Arctic ice cap formed it would chill the overlying air, which would flow down upon the surrounding regions. Behind these frigid winds the snows would swiftly advance to lower latitudes. Wind patterns would thus redouble the impact of the familiar cooling feedback caused by increasing reflection of sunlight. Only two stable states of the polar climate were possible, Brooks asserted — one with little ice, the other with a vast white cap on the planet. A shift from one state to the other might be caused by a comparatively slight perturbation, say, a change of ocean currents that put a little extra heat into the Arctic Ocean. Such a shift, he warned, might be shockingly abrupt.(32) |
|
|
| Scientists were beginning to recognize that feedback might grossly magnify the smallest change. The meteorologist W. J. Humphreys, for one, wrote in Atlantic magazine in 1932 that the current situation was close to the conditions where ice sheets had ruled. Thus "we must be just teetering on an ice age which some relatively mild geologic action would be sufficient to start going." As an example, he suggested that if a very wide sea-level canal were built across Panama, currents flowing through it might shut off the Gulf Stream, bringing "utterly destructive glaciation" to Northern Europe. Or dust thrown into the air by a series of volcanic eruptions, like the famous Krakatau explosion of 1883, might block enough sunlight to allow the formation of ice sheets. This ice, scientists now understood, might reflect enough sunlight to sustain the cold. | ||
| Humphreys also mentioned (following Chamberlin and others) that additional feedbacks could reduce the main greenhouse gases. Colder oceans would evaporate less water vapor into the air, and the colder water would also tend to take up more of the "Earth's blanket" of CO2. However, like nearly all the scientists of his time, Humphreys did not consider changes in CO2 particularly important. Believing that adding or subtracting the gas could have little effect on radiation, in their speculations about climate change they concentrated on volcanic dust, reflective ice sheets and the like.(33) | ||
| These models evidently left much room for chance. Some pointed out that ice sheets should be self-sustaining only in certain geological periods, when gross geographical changes such as uplifting of mountain ranges had created a suitable configuration. Even then, Brooks pointed out, "if the Arctic ice could once be swept away, it might find some difficulty in re-establishing itself."(34) He told a Life magazine reporter in 1950 that the Arctic ice had declined to a "critical size" and might no longer be able to chill the air enough to maintain itself. Melting might increase, and over centuries the seas might rise by tens of meters.(35*) |
|
|
| Experts sometimes worked these ideas up in a few equations, but the results were qualitative rather than numerically meaningful. Overall, theory remained in much the same speculative state that Simpson, as Director of the British Meteorological Office, had criticized back in 1922. Writers on climate, he had said, each pushed their own individual theory, and biased the evidence in their own favor. "There are so many theories and radically different points of view," he complained, "And new theories are always being propounded."(36) | ||
| Simpson himself did not resist the temptation to propound a personal theory, which can serve as an example of the general style of argument of the times. In 1937 he pointed out that, paradoxically, an increase of solar radiation might bring on an ice age. The logic was straightforward. A rise in the Sun's radiation would warm the equator more than the poles. More water would evaporate from the tropics and the rate of the general circulation of the atmosphere would increase. This would bring more snowfall in the higher latitudes, snow that would accumulate into ice sheets. The albedo of the ice sheets would cool the polar regions, while wandering icebergs would cool the oceans more broadly. Of course, if the Sun grew brighter still, the ice sheets would melt. Simpson worked out a complicated model of double-peaked glacial cycles, driven by a supposed long-term cycling in the level of solar radiation.(37) It was no more nor less convincing than anyone else's ideas. At a time when scientists could not explain the observed general circulation of the atmosphere, not even the trade winds, theories about climate change could be little more than an amusement. |
|
|
| Dishpan Experiments TOP OF PAGE |
|
|
| To wrestle with complex systems, for centuries scientists had imagined mechanical models, and some had physically constructed actual models. If you put a fluid in a rotating pan, you might learn something about the circulation of fluids in any rotating system — like the ocean currents or trade winds of the rotating Earth. You might even heat the edge of the pan to mimic the temperature gradient from equator to pole. Various scientists had tried their hand at this from time to time since the turn of the century.(38) The results seemed encouraging to the leading meteorologist Carl-Gustav Rossby, who invited young Athelstan Spilhaus to join him in such an experiment at the Woods Hole Oceanographic Institution in the 1930s. In their pan they produced a miniature current with eddies. If this represented an ocean, the current would have looked like the Gulf Stream; if an atmosphere, like a jet stream (a phenomenon not understood at that time). But they could not make a significant connection with the real world.(39) | ||
| Rossby persevered after he moved to the University of Chicago in 1942 and built up an important school of meteorologists. His group was the pioneer in developing simple mathematical fluid-dynamics models for climate, taking climate as an average of the weather seen in the daily circulation of the atmosphere. They averaged weather charts over periods of 5 to 30 days to extract the general features, and sought to analyze these using basic hydrodynamic principles. The group had to make radical simplifying assumptions, ignoring essential but transient weather effects like the movements of water vapor and the dissipation of wind energy. Still, they began to get a feeling for how large-scale features of the general circulation might arise from simple dynamical principles.(40) In the 1950s, Rossby's students and others moved this work onto computers. |
|
|
| Meanwhile, to get another peephole into the physics, Rossby encouraged Dave Fultz and others to experiment with rotating mechanical systems. Funding came from the Geophysics Research Directorate of the U.S. Air Force, always keen to get a handle on weather patterns. The Chicago group started with a layer of water trapped between hemispheres (made by sawing down two glass flasks). They were delighted to see flow patterns that strongly resembled the Earth's pattern of trade winds, and even, what was wholly unexpected, miniature cyclonic storms. The group moved on to rotate a simple aluminum dishpan. They heated the dishpan at the outer rim (and later also cooled it in the middle), injecting dye to reveal the flow patterns. The results, as another meteorologist recalled, were "exciting and often mystifying."(41) The crude, physical model showed something rather like the wavering polar fronts that dominate much of the real world's weather.(42) |
|
|
| Meanwhile a group at Cambridge University carried out experiments with water held between two concentric cylinders, one of which they heated, rotating on a turntable. Their original idea had been to mimic the dynamics of the Earth's fluid core in hopes of learning about terrestrial magnetism. But the features that turned up looked more like meteorology. "The similarity between these motions and some of the main features of the general atmospheric circulation is striking," reported the experimenter. The water had something like a little jet stream and a pattern of circulation that vacillated among different states, sometimes interrupted by "intense cyclones."(43) It seemed reminiscent of certain changing wind patterns at middle latitudes that Rossby had earlier observed in the atmosphere and had explained theoretically with a simple two-dimensional mathematical model (the "Rossby waves" seen in the meanderings of the jet stream and elsewhere). | ||
| Following up with his own apparatus, Fultz reported in 1959 the most interesting result of all. His rotating fluid sometimes showed a symmetric circulation regime, resembling the real world's "Hadley" cells that bring the regular mid-latitude westerly winds. But at other times the pattern looked more like a "Rossby" regime with a regular set of wiggles. This pattern was somewhat like the standing waves that form in swift water downstream from a rock (in the real Earth, the Rocky Mountains act as the rock). Perturb the rotating fluid by stirring it with a pencil, and when it settled down again it might have flipped from one regime to the other. It could also flip between a Rossby system with four standing waves and one with five. In short, different configurations were equally stable under the given external conditions.(44) This was realistic, for the circulation of the actual atmosphere shifts among quite different states (the great trade winds in particular come and go with the seasons). Larger shifts in the circulation pattern might represent long-term climate changes. |
|
|
| Fultz hoped that this kind of work would lead meteorologists to
"the type of close and fruitful interaction between theory and experiment,
mostly lacking in the past, that is characteristic of the older sciences."(45)
But in fact, fluid theory was wretchedly incapable of calculating
the behavior of even this extremely simplified model system. Anyway
the model was only a crude cartoon of the atmosphere, interesting
to be sure, but unable to lead to anything definite about our actual
planet. The real contribution of the "dishpan" experiments was to
show plainly that there was a simple physical logic hidden within the complexities of weather, creating regular climate patterns — albeit disturbingly unstable ones. |
||
| The behavior of the physical models reinforced a growing suspicion that it was futile to attempt to model the pattern of global winds on a page of equations, in the way a physicist might represent the orbits of planets. This mathematical research plan, pursued ever since the 19th century, aimed to deduce from first principles the general scheme of atmospheric circulation. But nobody managed to derive a set of mathematical functions whose behavior approximated that of the real atmosphere.(46) The huge ignorance of scientists was nakedly visible to the public, which looked with bemusement on the farrago of simplistic theories that science reporters dug out and displayed in magazines and newspapers. |
|
|
| Ewing and Donn's Unstable Climate TOP OF PAGE |
|
|
| The most influential new theory was deployed by two scientists at the Lamont Geological Observatory in New York, Maurice Ewing and William Donn. They had been interested for some time in natural catastrophes such as hurricanes and tsunamis.(47) Provoked by recent observations of a surprisingly abrupt end to the last ice age, they sought a mechanism that could produce rapid change. Also influencing them was recent work in geology — indications that over millions of years the Earth's poles had wandered, just as Wegener had claimed (although most geologists doubted this until better evidence turned up in the 1970s, see below). Probably Ewing and Donn had also heard about speculations by Russian scientists that diverting rivers that flowed into the Arctic Ocean might change the climate of Siberia. In 1956, all these strands came together in a radically new idea.(48*) |
<=Climate mod |
|
| Our current epoch of ice ages, Ewing and Donn argued, had begun when the North Pole wandered into the Arctic Ocean basin. The ocean, cooling but still free of ice, had evaporated moisture and promoted a pattern of severe weather. Heavy snows fell all around the Arctic, building continental ice sheets. That withdrew water from the world's oceans, and the sea level dropped. This blocked the shallow channels through which warm currents flowed into the Arctic Ocean, so the ocean froze over. That meant the continental ice sheets were deprived of storms bringing moisture evaporated from the Arctic Ocean, so the sheets began to dwindle. The seas rose, warm currents spilled back into the Arctic Ocean, and its ice cover melted. And so, in a great tangle of feedbacks, a new cycle began.(49*) |
=>sea rise, ice, floods |
|
| This theory was especially interesting in view of reports that northern regions had been noticeably warming and ice was retreating. Ewing and Donn suggested that the polar ocean might become ice-free, and launch us into a new ice age, within the next few thousand years — or even the next few hundred years. | <=Modern temp's | |
| The theory was provocative, to say the least. "You will probably enjoy some criticism," a colleague wrote Ewing, and indeed scientists promptly contested what struck many as a far-fetched scheme. "The ingenuity of this argument cannot be denied," as one textbook author wrote, "but it involves such a bewildering array of assumptions that one scarcely knows where to begin."(50) Talk about a swift onset of glaciation seemed only too likely to reinforce popular misconceptions about apocalyptic catastrophes, and contradicted everything known about the pace of climate change. Critics pointed out specific scientific problems (for example, the straits are in fact deep enough so that the Arctic and Atlantic Oceans would exchange water even in the midst of an ice age). Ewing and Donn worked to patch up the holes in their theory by invoking additional phenomena, and for a while many scientists found the idea intriguing, even partly plausible. But ultimately the scheme won no more credence than most other theories of the ice ages.(51) "Your initial idea was truly a great one," a colleague wrote Ewing years later, "...a beautiful idea which just didn't stand the test of time."(52) |
|
|
| Ewing and Donn's theory was nevertheless important. Picked up by journalists who warned that ice sheets might advance within the next few hundred years, the theory gave the public for the first time a respectable scientific backing for images of disastrous climate change.(53) The discussions also pushed scientists to inspect data for new kinds of information. For example, the theory stimulated studies to find out whether, as Ewing and Donn claimed, the Arctic Ocean had ever been ice-free during the past hundred thousand years (evidently not). These studies included work on ancient ice from cores drilled deep into the polar ice caps, work that would eventually provide crucial clues about climate change. Above all, the daring Ewing-Donn theory rejuvenated speculation about the ice ages, provoking scientists to think broadly about possible mechanisms for climate change in general. As another oceanographer recalled, Donn would "go around and give lectures that made everybody mad. But in making them angry, they really started getting into it."(54*) |
|
|
| Feedback Catastrophes? (1960s) TOP OF PAGE | ||
| Norbert Wiener, a mathematical prodigy, had interests ranging from electronic computers to the organization of animals' nervous systems. Working at the Massachusetts Institute of Technology during the Second World War on automatic control systems for antiaircraft guns gave Wiener novel insights into the general properties of complex systems. The result was a theory, and a popular book published in 1948, on what he called "cybernetics."(55) It was Wiener who popularized the use of the word "feedback," originally a technical term familiar mainly to electrical engineers. Wiener’s book drew broad attention to feedbacks and the stability or collapse of systems. These were timely topics in an era when electronics opened possibilities ranging from automated factories to novel modes of social communication and control. Through the 1950s, the educated public got used to thinking in cybernetic terms. Climate scientists were swimming with the tide when they directed their attention to feedback mechanisms, whereby a small and gradual change might trigger a big and sudden transition. |
|
|
| At the start of the 1960s, a few scientists began to think about transitions between different states of the oceans. Study of cores drilled from the seabed showed that water temperatures could shift more quickly than expected. A rudimentary model of ocean circulation constructed by Henry Stommel suggested that under some conditions only a small perturbation might shift the entire pattern of deep currents from one state to another. It was reminiscent of the shifts in the dishpan fluid models.(56) All this was reinforced by the now familiar concept that fluctuations in ice sheets and snow cover might set off a rapid change in the Earth's surface conditions.(57) |
|
|
| Similar ideas had been alive in the Soviet Union since the 1950s, connected to fabulous speculations about deliberate climate modification — making Siberia bloom by damming the Bering Straits, or by spreading soot across the Arctic snows to absorb sunlight. According to the usual ideas invoking snow albedo, if you just gave a push at the right point, feedback would do the rest. These speculations led the Leningrad climatologist Mikhail Budyko to privately advance worries about how feedbacks might amplify human influences. His entry-point was a study on a global scale. Computing the balance of incoming and outgoing radiation energy according to latitude, Budyko found the heat balance worked very differently in the snowy high latitudes as compared with more temperate zones. It took him some time, Budyko later recalled, to understand the importance of this simple calculation.(58) It led him to wonder, before almost any other scientist, about the potentially huge consequences of fossil fuel burning as well as more deliberate human interventions. | <=>Climate mod
|
|
| In 1961, Budyko published a generalized warning that the exponential growth of humanity's use of energy will inevitably heat the planet. The next year he followed up with more specific, if still quite simple, calculations of the Earth's energy budget . His equations suggested that climate changes could be extreme. In the nearer term, he advised that the Arctic ice pack might disappear quickly if something temporarily perturbed the heat balance. Budyko did not see an ice-free Arctic as a problem so much as a grand opportunity for the Soviet Union, allowing it to become a maritime power (although he admitted the longer-term consequences might be less beneficial).(59) |
|
|
| Even setting aside ice-albedo effects, interest in feedbacks was growing. Improvements in digital computers were the main driving force. Now it was possible to compute feedback interactions of radiation and temperature along the lines Arrhenius had attempted, but without spending months grinding away at the arithmetic. A few scientists took a new look at the old ideas about the greenhouse effect. Nobody fully grasped that the arguments about "saturation" of absorption of radiation were irrelevant, since adding more gas would make a difference in the crucial high, thin layers from which much of the radiation does escape into space. But the way radiation traversed the layers was attracting increasing scientific attention. As spectroscopic data and theoretical understanding improved, a few physicists decided that it was worth their time to calculate what happened to the radiation in detail, layer by layer up through the atmosphere. (The details are discussed in the essay on Basic Radiation Calculations, follow link at right.) |
|
|
| In 1963, building on pioneering work by Gilbert Plass, Fritz Möller produced a model for what happens in a column of typical air (that is, a "one-dimensional global-average" model). His key assumption was that the water vapor content of the atmosphere should increase with increasing temperature. To put this into the calculations he held the relative humidity constant, which was just what Arrhenius had done long ago.(60) As the temperature rose more water vapor would remain in the air, adding its share to the greenhouse effect. |
|
|
| When he finished his calculation, Möller was astounded by the result. Under some reasonable assumptions, doubling the CO2 could bring a temperature rise of 10°C — or perhaps even higher, for the mathematics would allow an arbitrarily high rise. More and more water would evaporate from the oceans until the atmosphere filled with steam! Möller himself found this result so implausible that he doubted the whole theory. Yet others thought his calculation was worth noticing. The model, as one expert noted, "served to increase confusion as to the real effect of varying the CO2 concentrations."(61) | ||
| Confusion is valuable when it pushes scientists to get a better answer. Möller's disturbing calculation was one stimulus for taking up the challenging job of building full-scale computer models that would take better account of key processes. By 1967 a team in Princeton led by Syukuro Manabe and Richard Wetherald had removed the runaway by adding more realism to a one-dimensional model. Going beyond almost every earlier attempt, Manabe added equations to show how air heated at the surface would rise to higher and cooler levels. This was the familiar process of convection, and it was what kept the surface temperature from rising indefinitely. The model resembled the actual structure of the atmosphere. Now Manabe's team doubled the simulated CO2 level — and the temperature rose a couple of degrees. For the first time, a plausible model showed the warming that Arrhenius had foreseen. Still, it would take another decade or two of hard work before computer models would offer a reasonably convincing simulacrum of the global climate as it existed, let alone a changing climate.(62) |
|
|
| Crude models of climate change became common during the 1960s, and some of them showed uncomfortably plausible possibilities for disaster. One reason these drew attention was that climate scientists were beginning to admit that there was no such thing as a "normal" climate. By now they had good long-term weather records, and analysis showed that weather patterns did not always swing back and forth around a stable average. The traditional model of a self-regulating balance of nature was gradually yielding to a picture in which climate continually changed. Feedbacks were no longer seen as invariably helpful, ever restoring an equilibrium. Rather, they might push the system into a fatal runaway. | <=Climatologists |
|
| The scientists were not causing a change of attitude so much as reflecting one that was sweeping through the world public. Many people were taking up the idea that humanity was liable to bring down global disaster on itself, one way or another. Crude calculations pointed to ruinous consequences from the spread of pesticides, radioactive materials, and above all nuclear war. People no longer saw all this as mere science fiction for teenagers, but as plain scientific possibility. | <=Public opinion |
|
| Alongside the occasional models of spectacular climate catastrophes, scientists continued to develop more workaday studies of how this or that force or feedback might influence climate. The subject remained a minor out-of-the-way field, salted with individualists who dreamed of winning honor by discovering the key to the ice ages or a way to predict droughts. As the Director of Research of the United Kingdom Meteorological Office remarked in 1963, nobody had yet produced a quantitative model that could show even "that the climate of the Earth should be distributed as it is." Without such a model for the present state of climate, so much the worse for understanding climate change — any discussion "is necessarily conjectural and inconclusive." That was no wonder, he pointed out, when even the most basic data, like the Earth's budget of incoming and outgoing radiation energy, were known only approximately. "With theory so rudimentary and the data so incomplete... the subject has largely been left as a topic for armchair speculation."(63) |
|
|
| Another expert tallied significant theories about causes of climate change extant in 1960 and came up with 54 distinct hypotheses. When a colleague looked again in 1968, he found the total had mounted to 60. "There is nothing to suggest that an end to the speculation on climatic change is in sight," he sighed. "It seems that we have a long way to go before the correct answer can be affirmed."(65) The few and scattered scientists who tried to do scientific work on climate change usually distrusted all the primitive models, including their own. Hardly anyone pursued a given idea except the author, who usually just presented a paper or two before moving on to more productive work. |
|
|
| As the 1960s proceeded, scientists found it harder to get any respect at all for a physical model unless it incorporated at least a few equations and numerical results. Such calculations, involving ice sheets or CO2 or whatever, became increasingly common, even if the product was often little better than hand-waving dressed up with graphs. As the power of computers rose, people began to think about building models that would work out the whole three-dimensional general circulation of the atmosphere. The main impetus was to predict daily weather, but some hoped eventually to learn something about climate. The early models did give a recognizable climate, but it was more qualitative than quantitative, no close reproduction of the Earth's actual climate. Such models were not easily built, however. One problem was that computers were too slow to handle millions of numbers in a reasonable time. But a worse problem was pure ignorance of how to build a general-circulation model. An infinitely fast computer would be no use unless it began with the correct equations for complex effects like the way moisture in the air became raindrops or snowflakes. | ||
| Many people preferred to keep on developing simple models of climate instability. Such models were easy and satisfying to grasp, and however qualitative and speculative they might be, they offered genuine insights. The best of these insights would eventually be incorporated into the gigantic computer models. Meanwhile some climate scientists took advantage of computers in a less expensive and arduous way, putting them to work on simple models and working out the numbers in minutes instead of weeks. |
|
|
| Budyko and Sellers TOP OF PAGE | ||
| Among various simplified models that were written down in a few equations and run through a calculation, the most important was built in the late 1960s by Budyko. He continued to worry about the climate modification proposals that had concerned Soviet climatologists since the 1950s, the grand schemes to divert rivers from Siberia or spread soot over the ice pack. Budyko and his colleagues recognized that existing models were far too primitive to predict how such activities might alter climate. At first, they tried instead to make predictions using the simplest sort of empirical model. They would study past climates, compiling statistics on what had happened during years when the ice pack was a bit smaller, the temperatures a bit warmer, the atmosphere a bit dustier. The way weather patterns had shifted in the past might well indicate how they would shift in response to future interventions. This resembled the traditional weather prediction method of "modeling" tomorrow's weather by looking up maps that represented days of similar weather in the past. The approach was also a natural extension of traditional climatology, with its piles of statistics and its idea of climate change as a simple question of changed weather patterns. |
|
|
| In service of this program, Budyko's institute in Leningrad had been laboriously compiling old temperature figures from around the world. He noticed an apparent correlation over the past century between fluctuations in global temperature and variations in atmospheric transparency, due to dust from occasional volcanic eruptions. Other climatologists reported similar findings in the late 1960s. Apparently temperature was sensitive to any haze of particles that lingered in the atmosphere. Budyko was well aware of vigorous ongoing debates over the general warming trend that had been reported for some regions, and he already expected that human industry would cause an accelerated warming. Moreover, studying new satellite data on the albedo of different parts of the Earth, he found dramatic differences depending on snow cover. Combining these separate concerns, he worried that a change in sea ice, or a similar feedback mechanism, "can multiply a comparatively small initial change in air temperature created by men's activities."(66) | <=Aerosols <=Modern temp's |
|
| To pin down the idea, in the mid 1960s Budyko constructed a highly simplified mathematical model. It was a "zero-dimensional" model that looked at the heat balance of the Earth as a whole, summing up radiation and albedo over all latitudes. When he plugged plausible numbers into his equations, Budyko found that for a planet under given conditions — that is, a particular atmosphere and a particular amount of radiation from the Sun — more than one state of glaciation was possible. If the planet had arrived at the present after cooling down from a warmer climate, the albedo of sea and soil would be relatively low, and the planet could remain entirely free of ice. (In particular, as Donn was continuing to insist, once the Arctic Ocean was free of its ice pack it would be less likely to freeze over in winter).(67) But the Earth had come to the present by warming up from an ice age, keeping some snow and ice that reflected sunlight, and so it could retain its chilly ice caps. |
|
|
| Under present conditions, the Earth's climate looked stable in Budyko's model. But not too far above the present temperatures and snow cover, the equations reached a "critical point." The global temperature would shoot up as the ice melted away entirely. That would give a uniformly and enduringly warm planet with high ocean levels, as seen in the time of the dinosaurs. And if the temperature dropped not too far below present conditions, the equations hit another critical point. Here temperature could drop precipitously as more and more water froze, until the Earth reached a stable state of total glaciation — the oceans entirely frozen over, the Earth transformed permanently into a gleaming ball of ice! Budyko thought it possible that our era was one of "coming climatic catastrophe... higher forms of organic life on our planet may be exterminated."(68) |
|
|
| Others were on the same trail, independently of Budyko's work in Leningrad — communications were sporadic across the Cold War frontiers. Already in 1964, a New Zealand ice expert, Alex Wilson, had offered some thought-provoking if schematic calculations. Antarctic ice sheets might be unstable enough to collapse so that icebergs would spread swiftly across vast tracts of the southern oceans, then melt away, raising and then lowering the Earth's albedo. He proposed that this "provides the 'flip-flop' mechanism to drive the Earth into and out of an ice age."(69*) The following year Erik Eriksson in Stockholm wrote a set of differential equations involving temperature and ice cover. The mathematics revealed instabilities that might lead to either "an explosive growth" or "a very rapid retreat of ice." As Eriksson explained in a 1965 conference on climate change, the system had a "'flip-flop' mechanism."(70*) | ||
| That was an extreme example of what the American meteorologist Edward Lorenz had begun to call "intransitive" effects. Under given external conditions, the atmospheric system could get itself locked into one persistent state or into another and quite different state. The choice might depend on only minor variations in the starting-point. These ideas were no doubt provocative, but so blatantly primitive and speculative that few scientists spent much time thinking about them. |
|
|
| What did at last catch attention was the drastic outcome of an energy-budget model published in 1969. The author, William Sellers at the University of Arizona, built on Budyko's and Eriksson's ideas. Rather than attempt another grand but rudimentary global model, Sellers computed possible variations from the average state of the actual atmosphere, separately for each latitude zone. The model was still "relatively crude," as Sellers admitted (adding that this was unfortunately "true of all present models"), but it was straightforward and elegant. Climatologists were impressed to see that although Sellers used equations different from Budyko's, his model too could approximately reproduce the present climate — and that it too showed a cataclysmic sensitivity to small changes. If the energy received from the Sun declined by 2% or so, whether because of solar variations or increased dust in the atmosphere, it might bring on another ice age. Beyond that, Budyko's nightmare of a totally ice-covered Earth seemed truly possible. At the other extreme, Sellers suggested, "man's increasing industrial activities may eventually lead to a global climate much warmer than today."(71) |
|
|
| The striking results published by Budyko and Sellers kindled increased interest in simple models. While some scientists gave them no credence, others felt that such models were valuable "educational toys" — a helpful starting point for testing assumptions, and for identifying spots where future work could be fruitful.(72) But did the Budyko-Sellers catastrophes reflect real properties of the global climate system? That was a matter of brisk debate.(73) |
|
|
| Other Planets: Venus, Mars, Ice-Age Earth (1970s) TOP OF PAGE |
||
| In the early 1970s, some scientists did find it plausible that feedbacks could build up a continental ice sheet more rapidly than had been supposed, as Ewing continued to insist. Other climate experts consistently rejected the idea. Aside from specific details, many continued to doubt the basic picture of a climate sensitive to small perturbations. For example, a 1971 climatology textbook pointed out that the Arctic Ocean occupied less than 5% of the globe's surface, and asked, "Is it not inherently improbable that the freezing and thawing of this surface should have major repercussions over the whole globe?"(74) Whether such magnified consequences were truly improbable got different answers from different scientists. Some went so far as to take seriously the idea offered by C.E.P. Brooks back in the 1920s, that thanks to feedback, frigid winds sweeping down from snow fields could move the snow line rapidly southward year by year.(75)(See above: Brooks.) Such a runaway freeze might possibly be triggered soon, according to some, as smog and smoke emitted by human industry increasingly shaded the Earth.(76) |
=>Aerosols |
|
| The opposite extreme — a self-sustaining heating of the planet — might be even more catastrophic, according to another set of calculations from simplified equations. In the early 1960s, telescope measurements had revealed that the planet Venus was at a temperature far above the boiling point of water. A dense blanket of water vapor and CO2 maintained a ferociously strong greenhouse effect. The furnace-like conditions not only kept water vaporized in the atmosphere but also kept the CO2 there, for the hot surface minerals would not absorb the gas. The system was thus self-perpetuating. Perhaps Venus had originally been similar to the Earth, only just enough warmer to begin evaporating gases into its atmosphere — greenhouse gases that had produced further warming, and so forth. If so, the end had been a "runaway greenhouse." According to one calculation, the Earth would need to be only a little warmer for enough water to evaporate to tilt the balance here as well. If our planet had been formed only 6% closer to the Sun, the authors announced, "it may also have become a hot and sterile planet." This was published in 1969, the same time as the work of Budyko and Sellers.(77) |
|
|
| By 1971, the risks to climate were under vigorous discussion in the small community of climate scientists. When Budyko presided over a large meeting in Leningrad, a rare occasion when most of the leading American, Western European and Soviet experts all met together, he put the issue to them forcefully. At the conclusion of the conference, where the organizer would traditionally sum up with some bland remarks, "Instead of general words," Budyko recalled, "I presented in short form an idea which proved to be absolutely unacceptable to everybody: the idea that global warming is unavoidable... The result was a sensation. Everybody had very strong feelings, and extremely unfavorable... A few very prominent men said, first, that it was absolutely impossible to have any [effect] of man's activity on the climate... And absolutely impossible to predict any climate change."(78) It was not pleasant, Budyko later recalled, to present unconventional ideas and provoke negative feelings, but the risk to the planet seemed so grave that it was important to provoke scientists to study the question and find whether the ideas were valid.(79) | ||
| Budyko was not alone in his concerns. They were taken up in an influential report (the "SMIC report") as the consensus of a major scientific meeting held in Stockholm that same year, 1971. The experts concluded that there was a possibility that a mere 2% increase or decrease of solar radiation, helped by albedo feedback, could leave the planet either totally ice-free or totally frozen.(80*) Budyko, Sellers, and others pressed ahead, finding that under a variety of simple assumptions, any model that gave a good representation of the Earth's present climate looked unstable and could just as easily produce a radically different climate.(81*) In 1972, Budyko calculated that a mere few tenths of a percent increase in solar radiation input could melt the ice caps. More important still, changing the level of greenhouse gases in the atmosphere would have an effect similar to changing the Sun's radiation. His model indicated that a 50% increase in CO2 would melt all the polar ice, whereas reduction of the gas by half "can lead to a complete glaciation of the Earth." Budyko went on to note that any changes in CO2 caused by natural geological processes had been overtaken by human activity. At some time "comparatively soon (probably not later than a hundred years)... a substantial rise in air temperature will take place." He offered a crude estimate (which would turn out to be not far off) that by 2020 global temperature would rise 1°C and the Arctic Ocean's summer ice would be reduced by half.(82) |
|
|
| Scientists tended to be skeptical about this entire genre of models. A mathematical model like those of Budyko and Sellers, built out of only a few simple equations, is quite likely to predict sharp changes. The more complex processes of the real world, however, might become saturated at some point, or react so as to counter any big shift. As one expert later remarked, many in the 1970s thought the Budyko-Sellers instability was a nuisance — "an artifact of the idealized models, and the usual approach was to dismiss it or introduce additional ad hoc mechanisms that would remove it."(83) The few who pursued the calculations found no easy way to avoid the catastrophic instability, but they understood that it would take a much larger and more complete computer model to produce credible results.(84) Sellers himself developed a somewhat more elaborate model (although it still took only 18 seconds on the computer to work out a year of climate change), and again he got a planet that was highly sensitive to perturbations. But he admitted that resolving the question must wait for some future "super-computer."(85) Besides, in the early 1970s the public had become agitated about possible climate shifts, and it could seem irresponsible to talk too loudly about world doom predicted by patently deficient models. |
|
|
| For generations meteorologists had found good reason to dismiss the hand-waving of theorists. Traditionalists did not like to see funds that could be spent gathering empirical data diverted to what they saw as airy speculation. The disagreement would continue for decades as a gradually shrinking minority of reputable experts decried all mathematical climate modeling, with or without computers, as fundamentally worthless. But the new generation was getting used to working with a "hierarchy" of models, ranging upward in complexity to intricate computer systems while always beginning with the proverbial "back of an envelope" equations. In a 1972 meeting the theorist Stephen Schneider, an advocate of these methods, jokingly introduced a simple energy-balance model by scribbling equations on the back of an actual envelope. "Some people were laughing," he recalled, but others "were humorless and hostile."(85a) | ||
| Some senior climatologists, attacking "the glibly pessimistic pronouncements about the imminent collapse of our terrestrial environment," stuck by their traditional intuitive model of climate as a self-regulating system. They continued to expect, for example, that a negative feedback from cloudiness would stabilize global temperature. But others were taking a new view of their field. Not only theoretical studies, but a flood of data on past climate changes were hard to reconcile with the old definition of “climate” as a long-term average of weather. An average made sense only if you calculated it over a period where things were roughly the same during the first half as during the second half. But was there ever such a period? As one prominent climatologist explained, "it cannot be ruled out... that [climate] varies on all scales of time." He admitted that "it can be argued that the very concept of climate is sterile," unless you gave up "the classical concept of something static."(85b) |
|
|
| In 1973, studies in wholly different fields brought new credence to the idea that positive feedbacks could defeat stability, with drastic results. A spacecraft reached Mars and sent back images with dramatic evidence that although the planet was now in a deep freeze, in the past there had been floods of water. Carl Sagan and his collaborators calculated that the planet had two stable states, and ice albedo feedback helped to drive the shift between them. Enormous flips of climate were apparently not a mere theoretical possibility but something that had actually befallen our neighboring planet.(86) For more on the way studies of other planets supported ideas of radical climate change, see the supplementary essay on Mars and Venus. | <=Venus & Mars |
|
| Another field of study produced even more telling news. By the mid 1970s, analysis of layers of clay extracted from the seabed gave unassailable evidence that ice ages had come and gone in a 100,000-year cycle, closely matching Milankovitch's astronomical computations of periodic shifts in the Earth's orbit.(87) Yet the subtle orbital changes in the amount of sunlight that reached the Earth seemed far too small to have a direct effect on climate. The only reasonable explanation was that there were other natural cycles that resonated at roughly the same timescale. The minor variations of external sunlight evidently served as a "pacemaker" that pinned down the exact timing of internally-driven feedback cycles. | <=Climate cycles |
|
| What were the natural cycles that fell into step with the shifts of sunlight? The most obvious suspect was the continental ice sheets. It took many thousands of years for snowfall to build up until the ice began to flow outward. A related suspect was the solid crust of the Earth. On a geological scale it was not truly solid, but flowed like tar. The crust sluggishly sagged where the great masses of ice weighed it down, and sluggishly rebounded when the ice melted. (Scandinavia, relieved of its icy burden some twenty thousand years ago, is still rising a few millimeters a year.) Since the 1950s, scientists had speculated that the timing of glacial periods might be set by these slow plastic flows, the spreading of ice and the warping of crustal rock.(88) Starting around the mid 1970s, scientists in a variety of institutions around the world, from Tasmania to Vladivostok, devised numerical models that indicated how 100,000-year cycles might be driven by feedbacks among ice buildup and flow, with the associated movements of the Earth's crust, albedo changes, and rise or fall of sea level. They rarely agreed on the details of their models, which of necessity included speculative elements.(89) But taken as a group, the numerical models made it plausible that ice-sheet feedbacks could somehow amplify even the weak Milankovitch sunlight changes (and perhaps other slight variations too?) into full-blown ice ages. |
|
|
| From Small Models to Big Computers
(1980s) TOP OF PAGE |
||
| Many scientists had converted by now to a new view of climate. No longer did they see it as a passive system responding to the (name your favorite) driving force. Now they saw climate as almost a living thing, a complex of numerous interlocking feedbacks prone to radical self-sustaining changes. It might even be so delicately balanced that some changes would be "chaotic," unpredictable. To be sure, many people stuck to earlier views. In 1976 the Director-General of the United Kingdom Meteorological Office told the public that "sensational warnings of imminent catastrophe" were utterly without foundation. "The atmosphere is a robust system with a built-in capacity to counteract any perturbation," he insisted.(90) That was becoming a minority opinion. | <=>Chaos theory |
|
| While models of ice-albedo and ice-sheet flow gave the most spectacular results, scientists developed a variety of other simple models. The most important and technically challenging models calculated how radiation was transferred through a column of the atmosphere. These increasingly accurate one-dimensional calculations were the underpinning for simplified energy-budget models incorporating changes in ice cover, atmospheric CO2, and so forth. Such models also provided basic elements to build into the proliferating full-scale computer models of the general circulation. | <=Radiation math |
|
| The huge computer models were taking over the field from simpler models. By the mid 1970s, everyone understood that it was hopeless to try to understand how climate changed by looking at just one or another feature, or even several features: you had to take into account all the mutually interacting forces at once. Digital computers were reaching a point where they might be able to do just that. Work increasingly concentrated on developing simple models of specific features that could be incorporated as components of more comprehensive models. Some scientists nevertheless continued to build elementary stand-alone models of various features, using them to garner insights that would be necessary to grasp the full climate system. | <=Models (GCMs) | |
| The most outstanding difficulty was the intricate problem of clouds. Everyone had assumed with little thought that more clouds obviously would reflect sunlight, and necessarily cool the Earth. But in the one-dimensional 1967 calculation mentioned earlier, Manabe and Wetherald had included the way that clouds not only reflected incoming sunlight but also intercepted radiation rising from below. Like greenhouse gases, the clouds could radiate heat back downward — or as one writer put it, "trap" heat on the surface. (After all, it's common experience that a cloudy night will typically be warmer than a clear one). Also, by absorbing some of the radiation coming from above or below, clouds would warm the layer of atmosphere where they floated. Furthermore, as the authoritative 1971 SMIC report noted, a climate change might alter not only the amount of clouds but also their average height. The height determined the temperature of the cloud surfaces, which affected how they radiated heat both upward and downward. The authors concluded that "clouds could act as a feedback mechanism" responding to global warming, "but the direction of feedback remains to be determined."(91) |
|
|
| In 1972 Stephen Schneider published a suggestive attempt to discuss the complexities in detail. He argued that while a greater amount of cloud cover would lead to net cooling, an increase in the height of the cloud tops would lead to warming. Overall his model was highly sensitive to small changes — not to mention being sensitive to its simplifying assumptions.(92) Further rudimentary calculations showed that all sorts of subtle and complex influences would determine whether a given type of cloud brought warming or cooling. |
|
|
| Another problem that needed much more work was smoke, dust, and other aerosols. Tiny atmospheric particles not only strongly influenced the formation of clouds, but interacted with radiation on their own. Some observations and primitive calculations showed that aerosols from volcanoes, and perhaps from human activity too, would have to be included in any realistic climate model. By the late 1970s, groups studying aerosols had built simple one-dimensional models and slightly more advanced models that averaged over zones of latitude. The models gave important results: the net effect of injecting aerosols would be global cooling. | <=Radiation math |
|
| Confidence in the results was bolstered when James Hansen's group used a simple model to compute the temporary cooling caused by the haze from a volcano that had erupted back in 1963; their results matched real-world data remarkably well. In particular, the model calculated that the higher layer of atmosphere (the "stratosphere") should temporarily warm up while the lower atmosphere cooled, which was just what had been observed. To be sure, knowledge of aerosols was so uncertain, and the normal fluctuations in climate were so great, that the volcano "experiment" could not prove anything for certain. "Nevertheless," as one reviewer commented, "the good agreement is rather satisfying."(93) |
|
|
| Another essential problem that people studied in simple models was the circulation of the oceans, which computers could not yet handle as part of a full-scale global simulation. Some modelers recognized that real understanding of long-term climate change would require models that coupled the atmosphere and oceans. They continued to offer hand-waving models to suggest how the interaction might behave. For example, in 1974 Reginald Newell offered some provocative ideas about rapid switching between two distinct configurations for heat transport by ocean currents — yet another way the entire system might lurch unexpectedly. Newell's ingenious mechanism involved the spread of sea ice over the ocean, but he noted that there could also be important Budyko-style albedo feedbacks, and other effects such as changes in the pattern of winds. His suggestions were "speculative," Newell admitted, "as indeed are all previous suggestions concerning the course of the ice ages."(94) |
|
|
| Simple models also remained necessary for studying conditions beyond the range of general-circulation models. The big models had a problem. Any tiny initial error in the physics or climate data tended to accumulate, adding up through the millions of numerical operations to give an impossible final result. The models gave stable results only when their initial parameters were adjusted ("tuned") until the outcome simulated current conditions realistically within a given range of conditions. Such a model was problematic outside its range. | <=Models (GCMs) |
|
| By 1976, a full-scale model had been built that not only simulated current climate but also, with the addition of continental ice sheets and other readjustments, gave a rough reproduction of conditions at the peak of the last ice age. (It was good enough to confirm the long-held assumption that ice and snow albedo were indeed important for sustaining an ice age.) But to dynamically compute the whole range of climates as ice ages came and went was far beyond this or any model's capacity. By the 1980s, the strangely regular cycles of ice sheet advance and retreat over the past several hundred thousand years were well determined, thanks to cores drilled from seabeds and ice caps. Scientists who took up the old challenge of explaining the cycles still had no recourse but simple models — a few equations including the time-delay for laying down and melting ice sheets, plus feedbacks such as changes in the level of CO2 in the atmosphere.(95) |
|
|
| The Persistence of Simple Models
(1980s) TOP OF PAGE |
||
| For analyzing climate under current conditions, mammoth supercomputer models took over the field toward the end of the 1970s. The last great contribution of primitive one-dimensional and two-dimensional calculations was to provide a check. The most complex three-dimensional computer models seemed more plausible once they were found to behave much the same as the simple models. Tests using a variety of small models came up with numbers close to the ones printed out by the biggest ones. The most important example was a landmark 1979 review of global warming by the "Charney Panel" of the U.S. National Academy of Sciences. While they used two full-scale general-circulation models as the basis of their much-cited estimate of future warming, their confidence relied on corroboration by a variety of simpler models. In short, introducing the myriad complexities of a full-scale model did not change the plain lesson of global warming contained in the elementary physics that stretched back to Arrhenius. | <=Radiation math |
|
| Simple models continued to serve in this fashion. For example, well into the 1980s scientists working for Exxon corporation used energy-balance models calculating exchanges between a few systems such as the atmosphere and oceans, one-dimensional atmosphere models, and the like, to predict warming in future decades. Their results (which would turn out to be quite accurate) were similar to the full-scale GCMs of the time . The corporation's leaders knew these results and presumably took them into account for long-range planning, even as Exxon's public relations and lobbying efforts insisted that models were unreliable and denied that global warming was anything to worry about. | ||
| During the 1980s, many scientists came to believe that the Earth was getting warmer, but that said nothing about the cause. A search got underway for "fingerprints" — specific patterns of climate change that would either point to the greenhouse effect, or point away from it to some other cause. As one example, both computer models and simple reasoning declared that when gases in mid-atmosphere blocked radiation coming up from the surface, that would leave the stratosphere above the gases cooler. By 1988, "a number of intriguing candidates are appearing that might be part of a fingerprint," a Science magazine report said, but "no one is claiming a certain identification of the greenhouse signal."(97) | <=Modern temp's |
|
| Whatever the cause of warming, elementary reasoning could predict some important consequences. Warming would not mean a slightly higher temperature on every day, but a serious increase in "heat waves," runs of days of extreme heat — harmful in many ways but especially to farmers.(98) That was one of the things that attentive journalists picked up from James Hansen's widely reported 1988 testimony to the U.S. Congress: the number of deadly heat waves would shoot up.(99) Furthermore, a warmer atmosphere would hold more moisture, so it seemed likely that the whole grand cycle of weather from evaporation to precipitation would intensify. The effects were debatable, but most experts felt that a warmer world would have worse droughts, worse floods, and worse storms — possibly all very much worse — although nobody could say just how bad these disasters could be, let alone where they might strike.(100*) |
|
|
| A wholly different approach was to "model" the greenhouse world on similar climates of the past. Paleontologists had traditionally studied rocks and fossils to find whether a region had once been jungle, prairie or desert. In the 1980s, Budyko encouraged Soviet geologists to extend this line of work into a detailed mapping of the last warm interglacial period, especially in the territory of the Soviet Union itself. They hoped that this would give an idea of how the world's climate map would appear during global warming in the 21st century.(101) This program was largely overtaken by much more detailed data deduced from studies of ocean floor mud and other precise measurements. Still, the Soviet studies did help to demonstrate that a warmer planet was likely to have a very different geographical distribution of warm, cold, wet and dry regions than at present. |
|
|
| A completely different group of simple models was meanwhile joining the discussion. It was essential to understand how biological systems interacted with both global warming and an increased CO2 level. What would changes in gases and temperature and precipitation do to forests, wetlands, and so forth? In particular, what would changes in vegetation mean for the emission of methane gas, the absorption of CO2, or the amount of dust in the air? This was important to climate science because such things could react back on the climate system itself, perhaps in a vicious circle. | <=Biosphere |
|
| Most people were more interested in another question: what might climate change mean for agriculture, forestry, the spread of tropical diseases, and other matters of human concern? By the early 1980s, some scientists found the risk of climate change great enough to justify an effort to work out preliminary answers. Simple models could give at least a rough idea as to how global warming might affect, say, the production of wheat in North America. A new area of research got underway with the customary features — research grants, conferences, articles in interdisciplinary journals like Climatic Change.(102) |
|
|
| Specialists in a variety of fields approached the issues with computer models. They plugged in equations and data on such things as how farmers might be forced to change the crops they grew, or how higher temperatures might affect electricity production or wildlife. "Impact studies," as this field came to be called, was rudimentary compared with atmospheric modeling. The underlying data came from only a few acres of woods or fields at a few locations, and the equations did not go far beyond hand-waving. Another and even simpler approach was the one pioneered by Budyko's Leningrad group, finding what the weather had been like in a given region during past periods of warmer climate, and asking how such weather might affect modern life. Here too the data were sketchy, and extrapolation to our own future little more than a guess.(103) What these studies did show was that it was more likely than not that a few degrees of warming would have important consequences for both natural ecosystems and human society — mostly nasty consequences. |
<=>Impacts
|
|
| Nobody would be able to predict precisely how the atmosphere would change, nor what the impacts of the change would be, without understanding all the interactions. Such studies required expertise in botany or agronomy or sociology as much as in geophysics. The climate science community dreamed of a grand model computing every factor together, not just the physics and chemistry but the biology (would trees and grass grow more abundantly and absorb extra CO2 as "fertilizer"?) and economics (would a rise of temperature promote more fossil fuel burning, or less?). Such a comprehensive model lay far in the future. Devising its multitude of component parts would take many years of development using simple models. |
|
|
| Simple Models vs. Skeptics (1990s-2000s)
TOP OF PAGE |
||
| There had always been a range of approaches to modeling. At one extreme were people who aimed for the most realistic and comprehensive maps of climate that could possibly be contrived, building ever more complex systems of parameters. At the other extreme were people fascinated by the dynamics of the system, who would rather play around with an idealized model, running it repeatedly while tweaking this or that feature to see what would happen. Despite the rapid improvement in the huge general-circulation computer models, the lovers of simple models continued to find useful things to do.(103a) | <=Models (GCMs) | |
| For one thing, simple models could lend conviction when critics disputed the incomprehensibly intricate computer models. As statisticians sought a definitive "fingerprint" to demonstrate the arrival of greenhouse warming, of course they compared their observations with the predictions from big models. But the conclusions seemed more solid when they showed features that Tyndall and Arrhenius had long ago predicted from elementary and ironclad principles. In particular, the simplest physical logic said that the blocking action of greenhouse gases would be most effective where outward radiation was most important for cooling the Earth: warming would come especially at night. And indeed a rise in the daily minimum temperature, mainly due to rising night-time temperatures, was plainly observed world-wide from the 1950s onward.(104*) The predicted increase in extreme climate events also seemed to be showing up in statistics, at least for the United States. Not long after, an increase of heat waves, floods, droughts and other impacts long predicted by simple models began to be tentatively observed around the world.(105) | ||
| Other climate changes that could be deduced easily from an enhanced greenhouse effect, but that would not follow from other influences, would likewise show up unambiguously in the early years of the 21st century. For example, if extra greenhouse gases in the lower atmosphere were indeed absorbing radiation coming up from the surface, that should cause a cooling of the stratosphere above these layers. A greenhouse-effect stratospheric cooling was not only plausible on elementary grounds but was calculated in 1967 by the first widely accepted global computer model, and all the more elaborate subsequent models. On the other hand, if the observed surface warming was due to a more active Sun, or many other possible causes, the atmosphere ought to warm up more uniformly. By the mid 2000s a stratospheric cooling was unequivocally observed: an unmistakable fingerprint of greenhouse-effect warming.(105a) | ||
| No less persuasive, Arrhenius and everyone since had calculated that the Arctic must warm more than other parts of the globe. The main reason was that even a little warming would melt some of the snow and ice, exposing dark soil and water that would absorb sunlight. Enhanced Arctic warming was a solid feature of models from the simplest hand-waving to the most sophisticated computer studies.(106*) And in fact, it was in places like the Arctic Ocean, Scandinavia, and Siberia that global warming became most noticeable in the 1990s. The area of ocean covered by ice declined sharply, so did the thickness of the ice pack, tree lines moved higher, and so forth. Studies mustering large amounts of data from around the Arctic showed that the 20th-century warming far exceeded anything seen for at least the past 400 years.(107) Humanity's "large scale geophysical experiment," as Roger Revelle had called it back in 1957, was producing data almost as if we had put the Earth on a laboratory bench to observe the effects of adding greenhouse gases. The data uniformly confirmed the basic theories. |
|
|
| These "fingerprints" of the greenhouse effect, combined with more elaborate computer studies and with the evident global surface temperature rise, did much to convince scientists and attentive members of the public that global warming was underway. Nevertheless, as a few critics pointed out, the pattern of modest temperature rise might be caused by other influences in the complex climate system.(108) If computer models agreed with old hand-waving arguments, that did not alter the fact that the modelers were still far from certain about the interactions with cloudiness and so forth.(109) |
|
|
| People who doubted that greenhouse warming was truly a problem continued to devise simple models of their own. Well into the 21st century, one or another critic (typically a person with some scientific training but no experience in the climate field itself) would labor through a simplistic calculation and claim it proved that the entire greenhouse warming theory was a sham. One bizarre example was an effort by John Sununu, chief of staff to President George H.W. Bush. Sununu had heard criticism that climate models did not calculate the mixing of heat into the oceans correctly, and therefore grossly overestimated future atmospheric warming. In 1990 he asked one of the government’s top modeling teams to give him a one-dimensional climate model that he could run on his Compaq 386 personal computer. "Sununu did not trust our big climate models," recalled Warren Washington, the team’s leader. "He wanted to do the computations himself within the White House." The team did their best to give the powerful politician a usable model, but of course in the end he was unable to disprove (or probably even to understand) their calculations. (109a) | ||
| The best actual scientific criticism came from a respected Massachusetts Institute of Technology meteorologist, Richard Lindzen. Around 1990 he began to challenge the way modelers allowed for water vapor feedback. This was the crucial calculation showing how a warmer atmosphere would carry more water vapor, which would in turn amplify any greenhouse effect. Lindzen believed the climate system somehow avoided that. He offered an alternative scenario involving changes in the way drafts of air carried moisture up and down between layers of the atmosphere. While Lindzen's detailed argument was complex and partly impressionistic, he said his thinking rested on a simple philosophical conviction — over the long run, natural self-regulation must always win out. His work also became, he confessed, "a matter of being stuck with a role." It was important for somebody to point out the uncertainties. |
|
|
| Few scientists found Lindzen's technical arguments convincing. Observations suggested that the way the modelers handled water vapor, although far from perfect, was not wildly astray. But it was only around this time that satellite instruments began to measure with any precision the greenhouse effect feedback between surface temperature and water vapor, and there was plenty of room to debate how clouds formed and moved water around. It took more than a decade to get observations that showed convincingly that moisture varied with temperature just as the models had predicted — the old assumption that all the modelers had used, constant relative humidity, was indeed valid. Lindzen's scenario was flat wrong.(110*) If anything, the feedback from water vapor might be positive, that is, a bit of extra vapor would accumulate in the atmosphere at higher temperatures, tending to accelerate the greenhouse warming.(110a) | ||
| Lindzen remained convinced that all climate models had so many uncertainties that their findings were meaningless, and he kept looking for some demonstrable flaw. Taking up the old idea that a warmer ocean should generate more clouds that would shade the planet, he dug up some data that tended to support his idea that the climate system thus stabilizes itself.(111) The data, however, came only from a limited region of the tropical Pacific Ocean where the effect was especially likely to be seen. Hardly any other expert thought Lindzen was right at last. Nevertheless his skepticism served a valuable purpose, provoking efforts to check the assumptions of the models. The results were disappointing for those who hoped clouds would solve the greenhouse problem. Around 2010 several studies were published affirming that cloud feedback was within the broad range that the models had expected. Further measurements tended toward a positive feedback, and by 2020 satellite observations confirmed this: changes in cloud cover, far from retarding global warming, were seriously accelerating it.(111a) | ||
| Still, nobody could dismiss out of hand Lindzen's complaint that computer results were based on uncertain assumptions. Although the models passed many rigorous tests, they also showed significant errors, deviating in various details from one another and from the actual climate. Evidently the modelers had not properly represented all the real-world mechanisms. Simple qualitative arguments would continue to be needed for checking the plausibility of any big model. | ||
| A Tool with Many Uses TOP OF PAGE | ||
| While the mainstream computer models grew ever larger and more complex, simpler sets of equations and even back-of-the-envelope calculations continued to be useful. The giant general-circulation models, adjusted to match recent climate parameters, had a hard time reproducing any situation too different. Above all there was the old problem of explaining ice ages — what conditions made a glacial epoch, and within such an epoch just what drove the cyclic ebb and flow of ice? To be sure, modelers could plant an ice cap on the planet and get a reasonable simulation of an ice-age climate. But that was a static snapshot, not a dynamic sequence showing what made the ice wax and wane over tens of millennia. The usual combination of plausible arguments and simple equations was applied in a variety of models, which now incorporated not only ice sheets but also shifts in ocean currents.(112) Although computers were starting to become capable of handling full-scale models for the ocean circulation, here too there was still room for simple plausibility arguments. |
|
|
| Such arguments were also the best way to study the interactions between glaciation and CO2. Measurements of ancient ice showed that during recent glacial periods, CO2 and methane had gone up and down roughly in time with the advance and retreat of the ice. Was the cycle governed not so much by ice or ocean dynamics as by emissions of gas, as Chamberlin had speculated a century back?(113*) Perhaps the gases served as an amplifying feedback, released into the atmosphere from seas and peat beds as a warm period began? There were so many interactions that a climate modeler remarked, "I have quit looking for one cause" of the glacial cycle. It was a microcosm of the development of all modern climate science, where early attempts to find a single cause for changes had given way to analysis of complicated mechanisms with many interacting parts, some perhaps not yet discovered. The mystery of the ice ages, which had launched a century of studies of greenhouse gases and climate, remained a challenge.(113a) |
|
|
| For the crucial problem of the current global warming, however, studies were converging toward definite answers. As often in science, a major impetus was advances in what had been an entirely separate field. In the 1970s geologists grudgingly acknowledged that the continents drift about like scum on a pond. Earth’s magnetic field, frozen into rocks when they formed, revealed the wandering earlier locations of the rocks. That opened the way to a genuine understanding of ancient climates of places like Paris and Antarctica, confirming, for example, that in some eras tropical summers had extended to the poles. (see above) |
|
|
| At the other extreme, computer modelers had been puzzling over the persistent tendency of their simulations to veer into the Budyko-Sellers instability, running away into a totally glaciated “snowball Earth.”(See above) Some had begun to wonder why that had not actually happened? (113b) Now geologists announced that at least once in the very distant past Earth’s oceans really had frozen over, perhaps entirely down to the equator. |
|
|
| In the 1980s the field of paleoclimatology (a word seldom seen before 1960) grew rapidly, generating a global community of researchers. Ingenious measurements of ice cores and of fossil leaves, shells, soils and so forth began to put numbers on ancient temperatures and CO2 levels. Paleoclimatologists, increasingly confident, complained that mainstream climate researchers were too fixated on current conditions. In particular, the approach that Budyko had attempted with limited success — using data about a past climate to draw an analogy with a greenhouse future — was coming into its own. | ||
| Probably the best analogue for our future climate was the Pliocene epoch some 5.3-2.6 million years ago, the last time CO2 in the atmosphere had risen above the 400ppm level that the world was now reaching and passing. Ominously, the Pliocene global temperature had been more than two degrees higher than at present and the sea level 25 meters higher. Still more alarming was the Paleocene-Eocene transition some 55 million years ago, when greenhouse gas levels and global temperatures had soared together to bring a mass extinction. More broadly, data across a range of ancient climates could give a rough number for climate "sensitivity," a number specifying just how much global temperatures changed as CO2 levels changed. The results were encouragingly similar to the numbers calculated by general-circulation computer models.(114) | ||
| In 2007 the climate community finally recognized paleoclimatology by giving the field its own separate chapter in the fourth comprehensive report of the Intergovernmental Panel on Climate Change (IPCC). As computer modelers increasingly tested their methods by trying to simulate past climates, a paleoclimatologist boasted that "the Pliocene has now entered the political mainstream of climate change science." In 2021 the IPCC's sixth report elevated paleoclimate studies to equal status with computer calculations for estimating global climate sensitivity.(114a) | ||
| Meanwhile the general-circulation models were not standing still. To extend the giant models' reach, people needed to continue building relatively simple models of specific processes like the interactions between biological systems and gases. With actual measurements remaining fragmentary, such limited models were yielding important insights that could be fed into the full-scale models. An example (called "one of the most robust predictions of the new dynamic global vegetation models") was a 1994 calculation that forests would tend to replace northern tundra as the world warmed. Here, as so often, there were complex and unexpected consequences. The dark evergreens would absorb much more solar radiation than the pale tundra, amplifying the global warming.(115) |
|
|
| Ice cores and other indicators showed that greenhouse gas levels during the 20th century were rising much faster than any change detected in the past. Was that why temperatures were likewise climbing more rapidly than any warming in the past millennium? The big general-circulation computer models with their millions of numerical operations could not yet reliably churn through a run of ten centuries. There was no way to keep small initial errors from accumulating, a little more each time the model ran through another year, until the whole computation veered off into unreality. But a simple energy-balance model could be adjusted until it responded smoothly to changes in gases, aerosols, and so forth in ways that by design mirrored the overall average responses of the big models. Thus modeling came full circle, with large computer systems used to calibrate a stripped-down version. The result, reported in 2000, was some of the most convincing evidence yet that the greenhouse effect was indeed upon us, rapidly growing more serious.(116) No matter how you manipulated any sort of model, if you could get it to simulate the current climate, it would show warming if you put in more greenhouse gases. | <=Rapid change
|
|
| Many agreed with a group of researchers who declared that the grand new "Earth System Models," engaging hundreds of different processes with millions of lines of code, "may be good for simulating the climate system but may not be as valuable for understanding it." The widening gap between big models and simple ones, they continued, was "particularly problematic for many researchers and students, who often have to work with limited computational resources. Furthermore, simple climate models are key to educational activities."(116a) | ||
| By now, some of the "simple" models run on desktop computers were comparable to what had been considered formidable state-of-the-art for the most advanced computations in the 1960s. (Of course, at that time everyone had recognized that those models were primitive.) Such a "simple" computer model could now be run not once but hundreds of times with different parameters. For example, you could get around the uncertainties in how the biosphere interacted with climate by building models with boxes for various regions and types of vegetation, then running these models through the entire range of plausible responses in each box. Another example: to address the large uncertainties in the parameters used to calculate such things as cloudiness, thousands of people cooperated to run simplified "screensaver" models using every reasonable combination of such parameters (nearly all of them produced global warming, and some got disastrously warm).(117*) |
|
|
| Simple models — hardly simple by the standards of 1970, but far more comprehensible than the enormous three-dimensional general-circulation models — also found increasing use in estimating the impacts of global warming. Specialized models were used, for example, to study how the strength or frequency of storms might change. Others evaluated changes already underway, as when a group calculated that global warming probably had a hand in the unprecedented 2003 heat wave that killed tens of thousands in Europe.(118) | ||
| Arguably the most influential of all simple models was very simple indeed, consisting of elementary global energy balance equations coupled to a basic model of the global carbon cycle. The model, tuned to mimic any of the great supercomputer models, could be run hundreds of times through different scenarios, each run spitting out a mean global temperature that the big model would have taken weeks to calculate. In 2009 the model revealed that no matter what the scenario for the way humanity's greenhouse gas emissions rose or fell over time, the global warming at any point in the future would depend on a single number: the total of the gases that humanity had emitted from the industrial revolution up to that point. To avoid disastrous heating, the world would have to keep within a strict "budget" for its total emissions... and the budget was already mostly used up.(118a) | ||
| A desktop-computer model became far more reliable and convincing once it was calibrated against a range of different full-scale general-circulation models. Then anyone could run it through hundreds of scenarios in the time it would take a full model to do just one run. Such models played a major role in the reports that the IPCC prepared for the world's policy-makers. For its 2001 report, researchers explored a large number of different assumptions for how much greenhouse gases humanity might emit over the coming century, getting rough predictions for the range of temperature and sea-level changes likely to result. For its 2007 report the IPCC ordered up an elementary model with one box representing land and one representing ocean in each hemisphere, adjusted so that the exchanges of heat between land and oceans, the responses to an increase in CO2, and so forth were all similar to the responses of state-of-the-art computer models. The model was then run through a variety of scenarios for the emissions that humanity might choose to allow in future, mapping out the range of likely consequences for different regions of the planet. |
|
|
| At the 2009 Copenhagen conference where the world's leaders assembled in a futile attempt to negotiate an agreement on reducing emissions, modelers provided a simulation that could be run on any laptop computer. Plug in one or another combination of national policies, and you could see roughly what future climate the full-scale models would be expected to calculate. What were now called "emulators," models with hundreds of thousands of lines of code that could give a result in seconds, made important contributions to the IPCC's big 2021 report. For example, they helped to sort out discrepancies among the far larger and far slower Earth System Models.(119) | ||
| The full-scale general-circulation models, ever grander, more complex, and more expensive, represented an approach to dealing with the world that some found neither appealing nor convincing. Doubling and redoubling the number of computations in each run, meanwhile adding a seemingly endless series of tweaks to key processes like cloud formation, confirmed the broad picture but left the big models differing widely on regional details, and even on the magnitude of global heating by 2100. Recurrent murmurs among experts called for giving better attention (and funding) to other types of models. Meanwhile more model types emerged; in particular, the advance of machine learning ("artificial intelligence") in the early 2020s opened new possibilities. Modelers outside the mainstream offered a variety of approaches, more comprehensible than the vast general-circulation models and more easy to verify within their special domains. If they were not overlooked in the shadow cast by gargantuan computations, they could add flexibility and plausibility to decisions about future policies.(120) |
|
|
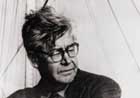

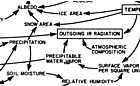
RELATED:
Home
The Carbon Dioxide Greenhouse Effect
Past Cycles: Ice Age Speculations
Supplements:
Chaos in the Atmosphere
Venus & Mars
| NOTES |
1. Callendar (1961), p. 2. BACK
2. Simpson (1939-40), p. 191. BACK
3. Ager (1993), p. xvi. BACK
4. A mid-century example of a technical text is Haurwitz and Austin (1944); and a more popular work, Hare (1953). BACK
5. E.g., "By 'climate' we mean the sum total of the meteorological phenomena that characterise the average condition of the atmosphere at any one place on the Earth's surface." Hann (1903), p. 1; I surveyed a sample of climate literature and textbooks, including, e.g., Blair (1942), pp. 90-94, 100-101; George C. Simpson, preface to Brooks (1922), pp. 7-8. BACK
6. Huntington (1914), p. 479. BACK
7. Landsberg (1946), pp. 297-98; for the history in general see Lamb (1995), pp. 1-3. BACK
8. For example, Chamberlin (1906), pp. 364-65. BACK
9. Tyndall (1873b), p. 117. BACK
10. The calculation requires understanding how radiation is emitted by a "black body," which was first measured in the late 19th century. The number that modern textbooks give for the temperature without an atmosphere is roughly -20°C, which is, not coincidentally, the average temperature of the upper layers of the Earth's atmosphere from which infrared radiation escapes into space. The exact number depends on Earth's current albedo (the fraction of sunlight the planet reflects). That number assumes the present state of clouds, forests, ice, etc. In the absence of an atmosphere, conditions would be different but the planet would still be frigid. A simple calculation finds that an ideal "black body" at Earth's distance from the Sun would be in radiative equilibrium at a temperature of -18°C (255°K). BACK
11. Referring to a box devised by Horace Bénédict de Saussure for his investigations in the 1760s of how the atmosphere is colder at higher altitudes, Fourier noted that "The effect of solar heat on air contained in transparent containers [enveloppes] has long since been observed." Fourier (1824); Fourier (1827); reprinted in Fourier (1890), quote p. 110; for historical discussion, see Fleming (1998), ch. 5, Fleming (1999); Pierrehumbert (2004). In 1896 Arrhenius somewhat inaccurately wrote, "Fourier maintained that the atmosphere acts like the glass of a hothouse," Arrhenius (1896), p. 237. The box in Fourier's analogy, invented by de Saussure, actually resembled a gardener's cold-frame more than a greenhouse; later 19th-century authors said the atmosphere acts like a sheet of glass without speaking of a greenhouse. Steve Easterbrook, "Who first coined the term 'Greenhouse Effect'?," Aug. 18, 2015, online here, traces the spread of the greenhouse analogy to Ekholm (1901) and the first use of the phrase "greenhouse effect" to J. H. Poynting, see Very (1908). Fourier had invoked an arrangement like a cold-frame, and later authors said the atmosphere acts like a sheet of glass but did not speak of a greenhouse. The key publication explaining that greenhouses are kept warm less by the radiation properties of glass than because the heated air cannot rise and blow away see Wood (1909); for the science, see also Lee (1973); Lee (1974). Probably the most influential use of the phrase "greenhouse effect" was by W.J. Humphreys in a 1913 article and in four editions of a textbook (1920 to Dover reprint 1964). Humphreys (1913), as cited in Powell (2015a), p. 257; Humphreys (1920), p. 566. Another widely seen use of the phrase "greenhouse effect" was in a 1937 textbook (repeated in later editions), wrongly describing "the so-called 'greenhouse effect' of the Earth's atmosphere" as an effect "analogous to that of a pane of glass." Trewartha (1943), p. 29. The term first appeared in American newspapers in the 1950s and was widely popularized in the 1970s, according to the Google News Archive (no longer online, alas). Book appearances of the term began in the 1920s and grew steadily except for a World War II dip 1940-1950, according to Google's nGram Viewer. A biographer of the later pioneer G.S Callendar attempted, without success, to name the anthropogenic greenhouse effect the “Callendar Effect." BACK
11a. This effect of adding CO2 takes place mainly in the side "wings" of the absorption spectrum, where adding gas makes the lines broader; the center is mostly saturated and the level where radiation of that wavelength is absorbed does not move much higher. Thanks to Daniel Burton for pointing this out to me.
For the physics-minded, a technical explanation of the greenhouse effect is Manabe and Broccoli (2020, ch. 1, and for more see the list of textbooks. BACK
12. Fourier admitted that "we are no longer guided in this study [of the temperature effects of the atmosphere] by a regular mathematical theory" Fourier (1827) (also in his 1824 paper); reprinted in Fourier (1890), p. 110. BACK
14. Tyndall (1863a), pp. 204-05. BACK
15. For energy budget models, see Kutzbach (1996). "Mutual reaction:" Hann (1903), p. 389. BACK
16a. "Control knob": Lacis et al. (2010). They describe "water vapor and clouds as the fast feedback processes in the climate system," whereas the "noncondensing greenhouse gases... provide the stable temperature structure that sustains the current levels of atmospheric water vapor and clouds" (p. 356); in terms of direct effects on radiation, they estimate water vapor accounts for about half the greenhouse effect, clouds for about a quarter, CO2 for 20% and other greenhouse gases 5%. BACK
17. Arrhenius (1896); see Crawford (1996), chap. 10; Crawford (1997); reprinted with further articles in Rodhe and Charlson (1998). For a fuller description of Arrhenius's model and other 19th century work see Easterbrook (2023), ch. 2. BACK
18. Arrhenius (1896), p 267. BACK
19. If Langley's measurements had been entirely accurate, Arrhenius would have come even closer to the warming given by current estimates, according to Ramanathan and Vogelman (1997). But S. Manabe (personal communication) points out that Arrhenius got reasonable results in large part because he underestimated the absorptivity of water vapor, and thus underestimated the crucial influence of water vapor feedback on the heat balance, a feedback kept within bounds in the real world by the upward convection of heat. BACK
20. Chamberlin (1897), "speculative" p. 653; see also Chamberlin (1898); Chamberlin (1899), "long chain" pp. 546-47; Tolman (1899); Fleming (1998), p. 90; Chamberlin (1923); for Chamberlin's work more generally, Fleming (2000); for Högbom's contribution, Berner (1995). BACK
21. Chamberlin (1897), quote p. 655. BACK
22. Gregory (1908), quote p. 347; similarly, "one can scarcely study it [the Chamberlin model] without profound admiration... Nevertheless, we are unable to accept it in full...," Huntington and Visher (1922), p. 42; for further background, Mudge (1997). BACK
23. Lotka (1924), pp. 222-24. BACK
24. Redfield (1958), 221, referring to atmospheric oxygen and other elements but not carbon. BACK
25. Nebeker (1995), pp. 123-24. BACK
26. Simpson (1939-40), p. 213; the "rather surprising" conclusion that even a change in solar output could be thus compensated was still accepted in 1956 by Rossby (1959), p. 11. BACK
27. E.g., deflection of the Gulf Stream by a continent in the Antilles, Hull (1897); glaciation from the raising of mountains, Gregory (1908). BACK
28. Harmer (1925), quote in discussion by Napier Shaw, p. 258. BACK
29. Brooks (1922a), p. 23. BACK
30. Köppen and Wegener (1924), "fast selbstverständliche und dennoch von einigen Autoren angefochtene," p. 3; Milankovitch published some of his ideas in a work to which Köppen and Wegener referred, Milankovitch (1920) ; for the full theory, see Milankovitch (1930); on energy-budget models 1920s-1960s, see Kutzbach (1996), p. 357-60. BACK
31. Callendar (1938), p. 239. BACK
32. Brooks (1925); Brooks (1949), chaps. 1, 8. BACK
33. Humphreys (1932); in his well-known textbook, Humphreys flatly denied the greenhouse activity of CO2, Humphreys (1940), p. 585. BACK
34. Brooks (1949), quote. p. 41, see chap. 12; Brooks (1951), p. 1013. BACK
35. Coughlan (1950). The cause would be melting of ice on Greenland and other land masses, since the melting of floating ice would not change sea level. BACK
36. Simpson, preface to Brooks (1922), pp. 8-9. BACK
37. Simpson (1934); Simpson (1937); "ice which enters:" Simpson (1939-40), p. 215; Willett (1949) elaborated Simpson's theory: each solar maximum would produce a single ice age, not two. BACK
38. References to work by Aitken, Exner, Taylor, Spilhaus, etc. are in Fultz (1949); for a historical treatment, see Fultz et al. (1959), pp. 3-5. BACK
39. A. Spilhaus, interview by Ron Doel, Nov. 1989. BACK
40. Stringer (1972), p. 10. BACK
41. Exciting: Smagorinsky (1972), p. 27. BACK
42. Fultz (1949); Fultz (1952); see also Faller (1956); for background Lorenz (1967), p. 118; Lorenz (1993), pp. 86-94. BACK
44. Fultz et al. (1959); Fultz et al. (1964); some of the results are shown in Lorenz (1967), see pp. 120-126. BACK
45. Fultz et al. (1959), p. 102. BACK
46. Eliassen and Kleinschmidt (1957) reviews mathematical approaches and their frustrations. BACK
47. In 1954, they sent foundations a proposal to study geophysical catastrophes, which could be "more deadly than wars." Folder "Donn, William," Individual Files Series, prelim. box 242, Maurice Ewing Collection, Center for American History, University of Texas at Austin. BACK
48. Ewing and Donn cited in particular 1955 papers on continental drift by S.K. Runcorn. According to Lamb (1977), p. 661, the first to recognize that an ice-free Arctic Ocean would lead to more snow near the ocean (based on observations of 20th century warm years) and that this could lead to onset of glaciation was O.A. Drozdov; the work was not published at once, and Lamb cites a later publication, Drozdov (1966). BACK
49. The process was accelerated because dark, open water absorbed more sunlight. Ewing and Donn (1956a); Ewing and Donn (1956b). Besides this albedo effect, which Ewing and Donn did not stress, it was later noted that sea ice is an excellent insulator, so that the air over the ice is tens of degrees colder in winter than if the air were exposed to the water. BACK
50. "enjoy": C. Emiliani to Ewing, 10 Oct. 1956, folder "Ice ages Paper," prelim. box 52, Ewing Papers, University of Texas. Contested: e.g., Schell (1957); "ingenuity" Crowe (1971), p. 493. BACK
51. Typical critiques: Sellers (1965), p. 213; and Crowe (1971), p. 493; Ewing and Donn (1958); see also Donn and Shaw (1966). BACK
52. Wallace Broecker to Ewing, 20 Jan. 1969, "Ewing" file, Office Files of Wallace Broecker, Lamont Doherty Geophysical Observatory, Palisades, NY. BACK
53. e.g., Science Newsletter (1956). BACK
54. W. Broecker, interview by Weart, Nov. 1997, AIP; data: e.g., a biologist reported pollen evidence that there was no open polar sea in the Wisconsin glacial period. Colinvaux (1964). BACK
55. Heims (1980); Wiener (1956b); Wiener (1948). BACK
57. E.g., Weertman offered calculations of ice cap instability in support of Ewing-Donn, Weertman (1961). BACK
58. Budyko, interview by Weart, March 1990, AIP. Smagorinsky, interview by Weart, March 1989, AIP, credits Budyko for introducing snow-albedo feedback with "hand-waving". BACK
59. Budyko (1961) ; Budyko (1962) . BACK
60. Möller (1963); Arrhenius (1896), p. 263. BACK
61. Eriksson (1968), p. 74. BACK
62. Manabe and Wetherald (1967). Stimulus: Manabe and Wetherald (1975). BACK
63. Sutcliffe (1963), pp. 276-78. BACK
64. [Duplicate note removed.]
65. Eriksson (1968), p. 68; the earlier source he cites was Schwarzbach (1963). BACK
66. Volcanoes: Budyko (1969); his interest in the observed warming is reported by Kondratyev (1988), p. 4; quotes and satellite data in Budyko (1972), p. 869; on Budyko's work in general in the Soviet context see Doose (2022). BACK
67. Donn and Shaw (1966). BACK
68. Budyko (1968); Budyko (1969), quote p. 618. BACK
69. Wilson (1964), p. 148; he pointed out that buildup of the Antarctic ice sheets was one of the few features of the Earth with a time constant that might match the long Milankovitch periods, Wilson (1969). BACK
70. The model was only mentioned casually at the conference, not as the main point of Eriksson's presentation, was not published until 1968, and attracted little notice aside from helping to stimulate Sellers' work. Eriksson (1968), "flip-flop," p. 77. BACK
71. Sellers (1969), quote p. 392, "rapid transition to an ice-covered Earth," p. 398. BACK
72. Robinson (1971), pp. 209, 214; cited with approval e.g. by Schneider and Dickinson (1974). BACK
73. Budyko (1972); Sellers (1973); North (1975). BACK
74. Crowe (1971), p. 493. BACK
75. Ives (1957); see also Ives (1958) ; Ives (1962); wind feedback: Lamb and Woodroffe (1970). BACK
76. Rasool and Schneider (1971); Lockwood (1979), p. 162. BACK
77. Ingersoll (1969); Rasool and de Bergh (1970). BACK
78. Symposium on Physical and Dynamical Climatology, as described in Budyko, interview by Weart, March 1990, AIP. BACK
79. Budyko, interview by Weart, March 1990, AIP. BACK
80. For support they pointed to semi-empirical studies of the way polar ice had rapidly disappeared during the warming of the 1930s. Wilson and Matthews (1971), pp. 125-29; they cite Budyko (1971). BACK
81. Out of five possible states, "The only completely stable climate is one for which the Earth is ice-covered," according to Faegre (1972), p. 4; "multiple steady states do exist," and which one would be found at a given time depended on the previous history, concluded Sellers (1973), p. 253. BACK
82. Budyko (1972), see Lapenis (2020). BACK
83. North (1984), p. 3390; see also North (1975), p. 1307. BACK
85. Sellers (1973), p. 241. BACK
85a. Schneider and Dickinson (1974) (a good review of the many models of the time) called for developing a hierarchy. Schneider (2009), p. 37, see 36-41, and for the history Polvani et al. (2017). BACK
85b. Senior climatologists: e.g., Kellogg (1971), pp. 131-32; concept of climate: Mitchell (1971, pp. 134-35. BACK
87. Especially Hays et al. (1976). BACK
88. E.g., Emiliani and Geiss (1959). They emphasize these ideas were not especially original with them. BACK
89. Examples: Weertman (1976a) (Northwestern Univ., IL, and the U.S. Army Cold Regions Research and Engineering Laboratory, Hanover, NH); note also his pioneering calculation of ice sheet buildup and shrinkage times, Weertman (1964); Sergin (1979) (Laboratory for Mathematical Modeling of the Climate, Pacific Institute of Geography of Academy of Sciences, Vladivostok, but written while visiting NCAR, Boulder, CO); Budd and Smith (1981) (Meteorology Dept., U. Melbourne); as a perhaps more typical example, Young (1979) (Antarctic Division, Dept. of Science and Technology, Kingston, Tasmania) conservatively showed a response time of perhaps 20,000 years; an especially influential model involving ice sheet buildup delay was Imbrie and Imbrie (1980); a good review is Budd (1981). BACK
90. Mason (1977), p. 23; see Gribbin (1976). BACK
91. Wilson and Matthews (1971), p. 122. BACK
93. Examples of useful techniques are Wang and Domoto (1974); Coakley and Chylek (1975); volcano: Hansen et al. (1978); reviewed by Ramanathan and Coakley (1978), quote p. 484; Charlock and Sellers (1980); Coakley et al. (1983). BACK
94. Newell (1974), p. 126. BACK
95. Pisias and Shackleton (1984). BACK
97. Charney Panel: National Academy of Sciences (1979), see essay on General Circulation Models. Exxon: Supran et al. (2023). "Intriguing candidates:" Kerr (1988), p. 560. BACK
98. Mearns et al. (1984). BACK
100. Hurricanes (50% higher "destructive potential" in future): Emanuel (1987); a trend had been detected of greater storminess in the North Atlantic 1962-1988, Carter and Draper (1988); for more recent work, e.g., Knutson et al. (1998); droughts ("severe drought, 5% frequency today, will occur about 50% of the time by the 2050s" in the U.S.): Rind et al. (1990); Karl et al. (1995) reported a rise in extreme precipitation events. Whether the hydrological cycle and tropical storms in particular will intensify is still debated, see Ohmura and Wild (2002) and the essay on "rising seas" here. BACK
101. Zubakov and Borzenkova (1990), pp. ix, 5-7. On Soviet climatology see Doose (2022). BACK
102. For example, Kellogg and Schware (1981); Rosenzweig (1985); Emanuel et al. (1985). BACK
103. IPCC (2001a), p. 748 includes 1980s references. BACK
103a. Dalmedico (2007), p. 138. BACK
104. Karl et al. (1986); Karl et al. (1991); Easterling et al. (1997). Warming should likewise be seen more in winter than in summer, and there are indications this is happening. More studies are being published every year, see the links page. BACK
105. Karl et al. (1996). More recent work is summarized in IPCC (2007a) and IPCC (2007c). BACK
105a. Predicted: Manabe and Wetherald (1967); confirmed: e.g., Thompson and Solomon (2005). BACK
106. The effect is much less in Antarctica, whose thick ice cover is not easily changed, and whose climate depends largely on surrounding ocean currents, but warming has been seen in the Antarctic Peninsula. Arctic warming is also enhanced by increased transport of heat energy in moisture carried from lower latitudes, and by thinner sea ice, which allows greater conduction of heat from the Arctic Ocean into the air. The first large model to demonstrate polar sensitivity was Manabe and Stouffer (1980); a more recent example is Manabe and Stouffer (1993). BACK
107. Overpeck et al. (1997). BACK
109. Wang and Key (2003) subsequently indicated that in fact circulation rather than radiation effects predominated in the arctic warming. BACK
109a. Washington (2007), pp. 96-105. BACK
110. Lindzen's essential argument was that warming would make an increase in tropical thunderstorm clouds, whose downdrafts would remove moisture from the upper atmosphere. Lindzen (1990); Kerr (1989b); "stuck with a role," quoted Grossman (2001); Lindzen has been accused of obfuscation, taking extreme ideological positions, and unjust ad hominem attacks, see e.g., Gelbspan (1997), pp. 49-54, but the accusation that Lindzen has been in the pay of industry is based only on lecture fees that Lindzen received. For the water vapor argument and other areas of debate with Lindzen, see Hansen et al. (2000), pp. 154-59. Corrections: Del Genio et al. (1991); Raval and Ramanathan (1989) found that satellite infrared measurements gave "compelling evidence for the positive feedback between surface temperature, water vapour and the greenhouse effect; the magnitude of the feedback is consistent with that predicted by climate models;" similarly, Rind et al. (1991), p. 500; Sun and Held (1996); and the final nail in the coffin, Soden et. al. (2005). Gettelman and Fu (2008) give a direct comparison between observations and general-circulation models. BACK
110a. Dessler et al. (2008); a brief review is Dessler and Sherwood (2009); see also Trenberth et al. (2015b). BACK
111. Lindzen (1997); Lindzen et al. (2001); Lindzen and Choi (2009). BACK
111a. Clement et al. (2009); Lauer et al. (2010); Dessler (2010); Trenberth et al. (2010). "The net radiative feedback due to all cloud types combined is likely positive,"IPCC (2014b), p. 16; Raghuraman et al. (2021). BACK
112. For a short review and references, see Broecker and Denton (1989), p. 2486. BACK
113. E.g., "the 100,000-year cycle does not arise from ice sheet dynamics." Shackleton (2000). BACK
113a. Kerr (1999); "quit looking:"Andre Berger. BACK
113b.Gleick (1987), p. 170. BACK
114. Kerr (2000b). A landmark work using paleoclimate data to derive sensitivity was Hoffert and Covey (1992). BACK
114a.Doose (2022); Jansen et al. (2007). "Political mainstream:" Haywood et al. (2009). IPCC (2021a). BACK
115. Foley et al. (1994); "robust:" Melillo (1999). BACK
116a. Polvani et al. (2017). BACK
117. Among the simplifications in the distributed model in the initial runs by www.climateprediction.net was a "slab" ocean instead of a circulating-ocean model, see Stainforth et al. (2005); Piani et al. (2005) estimate 5th/95th probability percentiles for future warming at 2.2 and 6.8°C. Similarly, Andreae et al. (2005) used a one-dimensional model with parameters that began with those from a three-dimensional general-circulation model and varied them within plausible limits, also finding a possibility of extreme warming.
118. Knutson and Tuleya (2004); Stott et al. (2004) BACK
118a. Allen et al. (2009), see Easterbrook (2023), pp. 296-98, and note in the "International Cooperation" essay. BACK
119. IPCC (2001a), ch. 9; Randall et al. (2007), section 8.8; Tollefson (2009). For another use see Wigley (2005). An example of use of an energy balance model calibrated against general-circulation models is Hegerl et al. (2006). Chris Smith, "Guest Post: The Role 'Emulator' Models Play in Climate Change Projections," CarbonBrief.org, Sept. 28, 2021, online here. General discussion: Baldissera Pacchetti et al. (2024). BACK
120. Shackley et al. (1998). BACK
copyright © 2003-2025 Spencer Weart & American Institute of Physics