Ice Sheets, Rising Seas, Floods
A big enough rise of global temperatures would eventually melt the world's glaciers, and indeed a retreat of mountain glaciers since the 19th century was apparent in many regions. That would release enough water to raise the sea level a bit. Worse, beginning in the 1960s, several glacier experts warned that part of the Antarctic ice sheet seemed unstable. If the huge mass slid into the ocean, the sea-level rise would wreak great harm, perhaps within the next century or two. While that seemed unlikely, by the 1980s scientists realized that global warming would probably raise sea level enough to affect populous coastal regions. After 2000, surprising changes in Greenland and Antarctica raised fears that ice sheet collapse might become dangerously rapid and impossible to halt. Meanwhile the sea level was rising higher and faster than for thousands of years, and the rate was accelerating. Problems would be redoubled as more powerful hurricanes made coastal storm surges worse, while stronger storm downpours inland brought their own floods.
| Subsections: Suspicions of Instability (1960s-1980s) - Evidence of Instability (1980s-2005) - Greenland and Pine Island Bay - Storms, Floods and the Future |
"The motto for early 21st Century cryospheric science might be, 'That happened faster than I thought it would'." — Christina L. Hulbe(1),
| Glaciologists, the scientists who study how ice behaves in seriously large quantities, have a special interest in floods. They even have their own word, jökulhlaup (from Icelandic), to describe the spectacular outbursts when water builds up behind a glacier and then breaks loose. An example was a 1922 jökulhlaup in Iceland. Some seven cubic kilometers of water, melted by a volcano under a glacier, rushed out in a few days. Still grander, almost unimaginably grand, were floods that had swept across Washington state toward the end of the last ice age when a vast lake dammed behind a glacier broke loose. In the 1940s, after decades of arguing, geologists admitted that high ridges in the "scablands" were the equivalent of the little ripples one sees in mud on a streambed, magnified ten thousand times. By the 1950s, glaciologists were accustomed to thinking about catastrophic regional floods. | - LINKS - |
| Also within their purview was flooding on a far grander, but far slower, scale. Since the heroic polar explorations of the late 19th century the world had known that great volumes of water are locked up in ice sheets. If there were substantial melting of the ice kilometers deep on Greenland, or the still more titanic volume of ice that buries Antarctica, the water released would raise the oceans in a tide that crept higher and higher for millennia. It had happened before: geologists identified beaches far above the present sea level, cut by waves several millions of years ago when the Earth was entirely free of ice. In a more recent time some 120,000 years ago (the Eemian interglacial period) when the continental ice sheets had melted but most of Antarctica remained ice-covered, the planet had reached a temperature at about the level that greenhouse warming was likely to bring in the coming century — and the sea level had been somewhere between 5 and 10 meters higher than at present (roughly 15-30 feet). This was about what would be expected if most of Greenland had melted. If that happened again, seawater would swamp coastal regions where a good fraction of the world's population now lived. All this became familiar to anyone who followed the early scientific discussions of global warming. |
|
| Up to the 1960s, scientists expected that global warming caused by greenhouse gases, if it happened at all, would steal in gradually over many centuries. So the threat of flooding lay in a comfortably vague and remote future. To be sure, a few scientists had begun to imagine more abrupt change if the melting of the ice itself brought on conditions that accelerated the warming. Transitions between glacial and warm climates — and back again — might come in a matter of only a few centuries if not faster. As one example, in 1947 the New York Times quoted a prominent Swedish geophysicist, Hans Ahlmann, who suggested that a global warming might be underway that could eventually bring a "catastrophic" rise of sea level as glaciers melted. "Peoples living in lowlands along the shores would be inundated," he explained, calling on international agencies to undertake studies as an urgent task. |
Full discussion in
|
| Starting in 1957, when serious scientific attention turned to the idea of greenhouse warming, a few senior scientists speculated that a rise in carbon dioxide emissions might inundate coastal cities within a century. Most scientists, however, expected that for the foreseeable future the main effect of any global warming on ice would be to shrink the ice pack on the Arctic Ocean. Since that ice was floating, it could melt entirely away without changing sea level at all, just as the level of water in a glass does not change when a floating ice cube melts.(1a) | |
| Suspicions of Instability (1960s-1980s) TOP OF PAGE | |
| Glaciers on land could affect sea level, and they were notoriously sensitive to climate. Advances and retreats of glaciers in the Alps in particular had been conspicuous for generations, reacting to small changes not just in temperature but also in the amount of snowfall.(2*) In 1962, John Hollin opened up speculation about how relatively small climate changes might also affect ice in Antarctica. He argued that the masses of ice there, piled up kilometers high and pushing slowly toward the ocean, were held in place at their fringes. The floating sheets of ice at the edges were pinned at the "grounding line" where they rested on the ocean floor. A rise of sea level could float an ice sheet up off the floor, releasing the entire stupendous mass behind it to flow more rapidly into the sea.(3*) | |
| The idea was picked up by Alex Wilson, who pointed to the spectacle of a "surge." Glaciologists had long been fascinated by the way a mountain glacier might suddenly give up its usual slow creeping, to race forward at a rate of hundreds of meters a day. They figured this happened when the pressure at the bottom melted ice so that water lubricated the flow. As the ice began to move, friction melted more water and the flow accelerated. Could the ice in Antarctica become unstable in this fashion? If so, the consequences sketched by Wilson would be appalling. As the ice surged into the sea, the world's sea-coasts would flood. And that would not be the worst of humanity's problems. Immense sheets of ice would float across the southern oceans, cooling the world by reflecting sunlight. It could bring a new ice age.(4*) Hollin joined in by publishing observations of deposits in England that recorded past sea levels, showing rapid rises of as much as ten meters. It could happen any time, he thought, perhaps in mere decades — or even faster if the sea-level change set off tsunamis. He pointed to unusual features that suggested an abrupt disaster, such as "the curiously intact remains of large mammals" buried whole.(5) Few scientists gave much credence to any of these speculations. The ice that covered most of Antarctica, in places more than four kilometers thick, seemed firmly grounded on the continent's bedrock. |
|
| However, in 1968 John Mercer, a bold and eccentric glaciologist at Ohio State University, pointed out a problem — the West Antarctic Ice Sheet (WAIS). This is a smaller, but still enormous, mass of ice, separated by a mountain range from the bulk of the continent. Measurements made in adventurous traverses of the ice during the International Geophysical Year 1957-58 had shown that much of the base of this mass was below sea level. Mercer argued that it was held back from flowing into the ocean, in a delicate balance, only by the shelves of ice floating at its rim. These shelves might disintegrate under a slight warming. The much larger mass of ice corked up by the shelves would then be released to slide into the ocean and disintegrate into icebergs. Just so, Mercer suggested, a collapse of ice sheets into the Arctic Ocean might have caused the more local, but remarkably sudden, cooling of the North Atlantic around 11,000 years ago that other scientists had identified. A West Antarctic Ice Sheet collapse could be very rapid, Mercer said. The sea level would not rise as far as it would rise if all of Antarctica surged, but it would be bad enough — up to five meters, he estimated (16 feet; calculations decades later pinned down the number at around 11 feet). Such a rise would displace more than a billion people and force the abandonment of many great cities. Mercer thought it could happen within the next 40 years.(6*) | <=Government
|
| Mercer published his worries in an obscure conference report, and although he wrote forcefully, he did not push his views on colleagues in the personal encounters that are crucial in a small community of specialists (he much preferred to be out doing fieldwork, often in the nude). The few specialists who heard of his ideas were not impressed. The problem, one of them complained, "could be argued indefinitely if it is not quantified."(7) | |
| In fact glaciologists had been working for decades on ways to calculate numbers for the flow of ice masses. In the 1970s they made rapid progress in formulating abstract mathematical models and putting the powerful new computers to work. The calculations, with many approximations, suggested that the West Antarctic Ice Sheet was indeed unstable. Apparently the floating ice shelf that held it back could break up with surprising ease, and the whole mass might begin sliding forward. One scientist who made a landmark calculation, Johannes Weertman, concluded that it was "entirely possible" that the West Antarctic Ice Sheet was already now starting its surge. |
|
| There were not many climate specialists and geologists with expertise in the properties of glaciers and ice sheets, the substantial fraction of the planet’s surface that experts were beginning to call the "cryosphere." They viewed the models as highly speculative. It seemed scarcely possible that anything as massive as the West Antarctic Ice Sheet could melt away in less than several centuries if not millennia. But if you took a long enough view to be concerned about the next few centuries, a surge that dumped a fifth of a continent of ice into the oceans would be no small thing, and they could not rule it out. The picture fitted with a new feeling that was emerging in the climate community, a feeling that the climate system in general was unstable or even radically chaotic.(8) |
<=>Rapid change |
| Concern sharpened in 1975 when Cesare Emiliani at the University of Miami reported measuring deep-sea cores that showed a shockingly rapid rise of sea level — a rate of meters per decade — around 11,600 years ago. (He remarked that this was exactly the time Plato had given for the fall of Atlantis!) Emiliani thought the cause of the flooding might not have been an Antarctic surge, but water rapidly released from enormous lakes that had been penned up behind the North American ice sheet, a titanic jökulhlaup. In places like Florida where the land sloped gently into the ocean, he wrote, "the sea would have been seen to advance inland 300 feet in... a single summer."(9) Other areas at risk included the Nile Delta and the Netherlands. Science journalists made sure that the more spectacular warnings reached a broad public.(10) |
|
| Meanwhile radar surveys from airplanes showed that the ice of West Antarctica moved toward the sea not as a single sheet but flowed in ice streams like colossal glaciers. Terence J. Hughes (who started out studying metallurgy but moved on to a different sort of solid material) and other glaciologists developed increasingly elaborate models of ice sheet dynamics.(11) They showed how a slight shift in conditions could prompt an ice shelf to break up into flotillas of icebergs. Looking over the new data and theories, Mercer worried that most climate experts still assumed that ice sheet changes would take many centuries. In 1978, he finally caught their attention with an article in the leading journal Nature, contending that because of global warming from humanity’s use of fossil fuels, "a major disaster... may be imminent or in progress." Mercer admitted that the computer models were loaded with uncertainties, but "there is, at present, no way of knowing whether they err on the optimistic or the pessimistic side."(12) | |
| Mercer, Hollin and Hughes had a chance to argue their case to a group of experts at a meeting convened in April 1979 in Annapolis, Maryland. One participant noted in his diary that their arguments convinced him that the deglaciation of West Antarctica was "a plausible hypothesis." The majority felt that this was "not a cause for immediate alarm however. We are talking about centuries."(13) In a published review, a trio of experts laid out arguments explaining why the collapse of an ice sheet would probably take several centuries to run its course. Yet they admitted that "little is known about the glaciers," and a 5-meter rise in sea level could possibly happen within a century. "Mercer's warning," they concluded, "cannot be dismissed lightly."(14) | |
| That continued to be the most common view through the 1980s. Studies indicated that an ice sheet collapse should take centuries rather than decades, but experts knew too little about the behavior of Antarctica's mammoth ice rivers to reach a confident conclusion. Discussions were collegial, but it seemed that almost any proposition that one scientist advanced would be sharply contradicted by another. Field glaciologists, a small but hardy group, measured one or another ice sheet as best they could at a few scattered locations. They found ice streams moving consistently at speeds of hundreds of meters a year, far faster than ordinary mountain glaciers. Meanwhile, their mathematically-minded colleagues back home constructed simplified models for the flow.(15) | |
| Some studies foresaw the possibility of a sea-level rise of two or three meters (6-10 feet) by 2100, but most found this unlikely so soon. For example, Roger Revelle, the dean of oceanographers, estimated in a 1983 National Academy of Sciences report that within the next hundred years the sea level would probably rise some 70 cm (about two feet). That sounded harmful but not devastating. Revelle did warn, however, that a truly catastrophic Antarctic ice-sheet collapse might be possible in future centuries.(16*) | |
| Some rise of sea level in the coming century seemed not just possible, but nearly certain. The oceans had already risen 10 or 20 centimeters in the 20th century. (Later studies showed that the rise had begun in the mid 19th century, and was now many times faster than in previous millennia.) Just where all the water had come from remained uncertain. As one example, it was not until the 1990s that experts realized that significant volumes of water were involved in human activities like irrigation and building reservoirs, and they could not say whether the net result of such activities was to take water from the oceans or to put more in.(17) | |
| One contribution to the sea-level rise was entirely clear. Water expands when heated. The consequences may seem obvious, but amid all the talk of melting glaciers, for decades nobody seems to have given much thought to this simple effect. Finally in 1982 two groups separately calculated that the global warming observed since the mid-19th century must have raised the sea level significantly by plain thermal expansion of the upper ocean layers. But a thermal expansion could not account for all of the observed rise. The scientists figured the rest came from melting glaciers (most of the world's small mountain glaciers were in fact shrinking).(18) | |
| The rising waters might help the West Antarctic Ice Sheet float off its moorings and slowly break up. Even if that never happened, there would still be problems. Scientists warned that the world's tides would probably mount a half meter or even a meter and a half higher by the end of the 21st century, bringing severe harm to coastal regions. Beaches would erode back a hundred meters or more. Salt water would advance into fragile estuaries. Entire populations would flee from storm surges.(19*) | |
| While the calculations of thermal expansion were straightforward, the actual sea-level rise would depend on a much tougher problem — what would happen to the ice sheets of Greenland and Antarctica? So long as they did not surge and disintegrate, global warming would not necessarily make them dwindle. A warmer atmosphere would hold and transport more water vapor, so it would drop more snow. Thus the polar ice sheets might actually grow thicker, withdrawing water from the oceans. The future sea level depended crucially on just what happened to glaciers and ice sheets, one pair of experts concluded, and predicting that would be "a daunting task." Most glaciologists believed that the stupendous masses of polar ice had so much inertia that their collapse was a problem that could safely be left for future generations to worry about (anything more than a century ahead seemed a long way off). But there were a few, notably Mercer, Hughes and Revelle, who took the uncertainty seriously enough to call for research that would settle the question promptly. As one advocate pointed out, "ultimately the research is very simply to determine what our fossil fuel policies will be."(20) | |
| Evidence of Instability (1980s-2005) TOP OF PAGE | |
| To sketch out an answer to the great question of ice-sheet collapse, since the early 1980s increasing numbers of scientists had bundled up in parkas and gone out onto the windswept wastes of Antarctica. It was grueling work, isolated and dangerous. Researchers measuring the ice streams learned to travel with their snowmobiles roped together like mountaineers (despite precautions, in 2016 glaciologist Gordon Hamilton died when his snowmobile plunged into a hidden crevasse). Their difficult goal was to measure the motions of the immense slow ice currents, using radar pulses, seismic measurements, and boreholes to study how ice moved over the rock beneath. One example was a scientist who had been skeptical of surge models — he recalled that he "felt the whole thing was like a house of cards" — but who changed his mind when he discovered that a kilometer-thick Antarctic ice stream rested not on bedrock but on a layer of slippery mud. Another unsettling discovery was that in recent centuries some of the great ice streams had stopped or started moving, for no clear reason.(21) | |
| Far more such data would be needed to bring a definitive answer. The dynamics of ice sheets and the streams that fed them turned out to be, like most things geophysical, a complicated snarl of influences. Experts could not even agree on whether the West Antarctic Ice Sheet had disintegrated during previous warm periods during the past few million years. The past sea-level rises might have come from Greenland ice, or from something else entirely. But according to evidence developed in the 1990s, during a dramatic episode at the end of the last ice age, something had once raised the sea level 16 meters within three centuries. The rate of rise might have reached two feet per decade. The West Antarctic Ice Sheet was the most likely source of all that water. The rush of new data fed what one observer called "polite but emotional debate" among experts. And there were indeed West Antarctic Ice Sheet experts now. Since the 1980s a small interdisciplinary and international community had coalesced in ad hoc workshops at various locations.(22*) | |
| Meanwhile a powerful new tool, satellite images, revealed that some relatively small floating ice shelves, fringing the peninsula that projects from the Antarctic continent, were rapidly disintegrating.(23) It was not clear whether the changes had anything to say about the possibility of a catastrophic ice-sheet collapse. In these little-known regions, the changes might have been a type of normal, regional event, which just had not been noticed before the age of intensive global monitoring. Yet the public's concern about global warming was reinforced from time to time when satellite images showed tabular icebergs bigger than cities floating off. And scientists began to doubt that this was normal. After all, back in 1978 Mercer had called for keeping an eye on just these ice shelves, contending that their breakup would be "one of the warning signs that a dangerous warming trend is under way in Antarctica." He had specifically predicted that the collapse of ice shelves would start at the northern end of the Antarctic Peninsula and proceed south, and indeed by 1996 the five most northern ice shelves were shrinking rapidly, but not the more southerly ones.(24) |
|
| In the 1980s and '90s specialists in glacier flow worked up increasingly complex ice-sheet models, using the rapidly expanding power of computers to incorporate essential features such as three-dimensional heat flow within the ice.(24a) Entirely aside from the question of Antarctic surging, these models might be useful in explaining past ice ages. It seemed increasingly likely that the reason ice sheets came and went in cycles of around 100,000 years had something to do with the length of time needed for a continent of ice to form and flow and melt, while the entire rocky crust beneath it sluggishly sank or rebounded as the weight of ice grew or diminished. Nothing else on Earth seemed to change on the right timescale. |
|
| The models failed to answer the question of how fast a major ice sheet could surge into the ocean. The improved models did show, reassuringly, no plausible way for a large mass of Antarctic ice to collapse altogether during the 21st century. According to these models, if the West Antarctic Ice Sheet diminished at all, it would discharge its contents over several centuries, not placing too heavy a burden on human society. Yet scientists could not altogether rule out the possibility of a shocking surprise in some future generation. The West Antarctic Ice Sheet remained what one expert had called it a quarter-century earlier — "glaciology's grand unsolved problem."(25) | |
| Scientists were still less able to answer the question of whether climate change was gradually melting the rest of the world's glaciers and ice caps, or instead was adding snow to them. In "those huge areas where little or no information is available," an expert explained in 1993, "almost anything might be happening." But in 2005 a survey of mountain glaciers around the world found that most of those for which historical records existed had been shrinking since 1900. Some that had survived for many thousands of years were vanishing, a striking sign of unprecedented climate change. Experts could only speculate how far this might affect sea level. Would it be counteracted by the increased snowfall that some models predicted global warming would bring in the remote dry highlands of Antarctica?(26*) | |
| As scientists turned
increasing attention to ice movements, they discovered many kinds
of changes, thanks to airplane overflights and satellites as well as increasingly precise measurements by arduous expeditions
on the ice itself. "Perhaps the most important finding of the past
20 years," a glaciologist reported in 2002, "has been the rapidity
with which substantial changes can occur on polar ice sheets." Experts were surprised to find that Greenland seemed to be already losing ice, which drained out through the many glaciers faster than it accumulated in the middle. In Antarctica, entire floating ice shelves astonished experts by breaking up and vanishing. Scientists had long disputed whether such shelves held back the ice streams that fed them; the controversy was resolved when the Larsen B shelf disintegrated abruptly in 2002, and the streams behind it promptly accelerated. "That was a real wake-up moment for the whole community," a glaciologist later recalled. |
|
| Most scientists had figured that even after the air got warm enough to melt the surface of an ice shelf, it would take millennia for the entire great mass to melt away. It turned out, however, that meltwater could seep down into crevasses, refreeze there and wedge them wider, prying apart a thick sheet in months. Meanwhile the gradually warming seawater worked to break up the ice from beneath. None of this had been foreseen by the crude computer models of ice behavior. |
|
| Modelers scrambled to incorporate the new concepts. Revised computer simulations and further observations confirmed the idea, originally so speculative, that removing an ice shelf could dramatically speed up the drainage of glaciers corked up behind it. In 2004 evidence was published that some of the enormous ice streams leading from the West Antarctic Ice Sheet to the ocean were indeed speeding up. Scientists were no longer sure how many centuries it might take to drain the entire sheet. "The response time scale of ice dynamics is a lot shorter than we used to think it was," admitted a leader of the research.(27*) |
|
| Only a few people were trying to make computer models of any of these processes, and their models remained primitive. A mass of ice is an odd substance, something between a fluid and a solid, no easy thing to simulate. And far too little data had been gathered from the surfaces of these perilous and remote wastes, let alone from their buried base. The most modelers could say was that "The latest theoretical advances have done nothing to allay fears concerning the potential instability of marine ice sheets."(28) | |
| When the Intergovernmental Panel on Climate Change (IPCC) assembled its authoritative 2007 report, the authors found the new ideas about ice sheets altogether too uncertain. So for their sea-level predictions they stuck with the easily calculated rise due to the expansion of warming ocean waters plus the old, classic models for ice processes. They took no account of the possibility of ice surges (the report was based on papers published in peer-reviewed journals through about 2005, which left out some disturbing findings, discussed below). Back in 2001 the IPCC had offered a rough guess that the total rise expected by the end of the 21st century would be half a meter, give or take. The authors of the 2007 report came up with much the same numbers, 0.2 to 0.6 meters, explicitly excluding "rapid dynamical changes in ice flow." Policy-makers and the press scarcely noticed this refusal to figure in the possibility of ice-sheet collapse, even though it brought sharp criticism from some experts. For example, an obscure 2008 official report by U.S. science agencies discreetly warned that if proposed mechanisms for ice-sheet collapse were taken into account, the sea-level rise by the end of the century could "substantially exceed" the IPCC's projections; in other words, the threat of a catastrophic rise was real.(29) | |
| Greenland and Pine Island Bay TOP OF PAGE | |
| Starting around 2000, a few studies raised the possibility that the Greenland Ice Sheet, contrary to what most scientists had figured, might not be comfortably stable over the next few centuries. In the warmer summers the snow on the surface would get wet, and become darker. So it would absorb more sunlight and warm still more. Under one speculative scenario, rivers of water would drain through deep holes ("moulins") straight to the bottom of the ice and lubricate it. That might provide, as one team put it, "a mechanism for rapid, large-scale, dynamic responses of ice sheets to climate warming." Another mechanism might be thinning and crevassing at an ice stream's front end, due to warmer ocean water, causing a speedup that propagated upstream. As the flow of its huge ice streams accelerated, the Greenland Ice Sheet would thin around the edges. As the ice surface sank to lower altitudes where the air was warmer, it could melt all the faster. Conceivably, an armada of icebergs would invade the North Atlantic and melt, as had happened around the end of the last ice age. At that time the sea level had risen at a rate that would be catastrophic for coastal areas. The process would presumably take centuries to run its course, if not millennia, but glaciologists could only speculate about the probability and timing of such a misfortune.(30*) |
=>Rapid
change |
| A 2006 analysis of satellite radar data found that the velocities of large ice streams in southern Greenland had doubled in the past five years — something most experts had thought was impossible. Perhaps the speculations about lubrication of the base of an ice stream were correct? The Greenland ice streams soon slowed down again, however, showing that the lubrication was temporary; a long-range study reported that these particular streams were discharging ice into the sea no faster, on average, than a decade earlier. Glaciologists were not reassured. Considering how ice streams around Antarctica had also been observed to speed up and slow down suddenly, it seemed that these systems were more sensitive to perturbations than the scientific community at large assumed. Meanwhile, a new satellite began to transmit worrisome data. It measured gravitational force so sensitively that it could detect changes in the mass of an ice sheet from year to year. Both Greenland and West Antarctica were in fact losing substantial amounts of ice into the oceans. Observers were dismayed to see mass around the margins of Greenland dwindling at a rate that doubled in less than a decade. To be sure, the record was short, and variability was the rule with ice (a later study calculated that Greenland had lost ice about as fast during the North Atlantic warm spell of the 1940s). |
|
| If the loss did continue, what would be the end-point? During one interglacial period some 400,000 years ago, the world had been a degree or two warmer than at present with a sea level ten meters or so higher. An ingenious study of sediments found that southern Greenland had been largely ice-free at that time. That meant the island had been a main contributor to the sea-level rise. In 2024 a team at the highest point in Greenland extracted a three-kilometer core and found tundra plants at the bottom: at some point in the past million years, the great ice sheet had entirely melted away.(31*) | |
| The news from Antarctica was even more perturbing. Since the 1980s, European and American expeditions had been measuring the ice streams held back behind the Ross Ice Shelf and adjacent regions; they had found no worrisome acceleration. But there was a second region, Pine Island Bay, where narrower ice streams fed into the ocean. This was one of the most inaccessible places on the planet, with terrible weather besides, and it had scarcely been observed even from the air. Yet the terrain was such that already back in 1981, Terry Hughes had suggested that warming might accelerate the ice streams there. He had called Pine Island Bay the "weak underbelly" of West Antarctica.(32) | |
| The region had been lit up as by a flash of lightning with the 1991 launching of the satellite ERS-1, "the single most effective tool ever devised for measuring glacial change." The satellite's radar, peering through clouds and the long Antarctic night, could measure the ice surface with amazing precision. In 1998 Eric Rignot reported that the line where the Pine Island glacier was held back by the seabed had retreated five kilometers within half a decade. He thought that the glacier's floating tongue was being eroded underneath by the warmer ocean waters. Another group found that the entire glacier basin feeding into the ice stream was losing altitude.(33) |
|
| Glaciologists buckled down to study the neglected region. By 2009 they found that the ice streams entering Pine Island Bay were rapidly accelerating, and the basin that fed them was dropping 16 meters a year. "We don't really know what's going to happen to the ice," remarked a British team leader. Would the ice streams surge as Hughes had warned? The situation was clarified in 2013 when a consortium of more than a hundred scientists managed to extract an ice core from Greenland dating back to the Eemian interglacial period. They found that Greenland had not all melted away then, so an important part of the 5-10 meter Eemian sea-level rise must have come from Antarctica. (A decade later, an ingenious study using the distribution of coastal sea life gave evidence that much of the vast West Antarctic Ice Sheet had in fact been missing at some point during the Eemian.) To be sure, the melting had presumably proceeded at a truly glacial pace. Most experts felt that at worst West Antarctica might contribute ten centimeters or so to the total sea-level rise of the 21st century. |
|
| Bigger problems would come, gradually but inexorably, in the 22nd century and after. Observational and computer studies published in 2014 confirmed that major ice losses were highly likely. There were no ridges in the Pine Island Bay seabed that could act as grounding lines to pin down the Pine Island glacier, nor the even grander Thwaites Glacier (as big as Great Britain), which also flowed into Pine Island Bay, and others — nothing to stop them from retreating inexorably century after century. They would spill gigatons of West Antarctic ice into the ocean. The West Antarctic Ice Sheet collapse, Rignot declared, was "irreversible... it has passed the point of no return." Other experts hesitated to make such drastic predictions, for they still had much to learn about the great ice sheets.(34*) |
|
| Was this something of concern only to generations of the far future? For decades a few scientists had been issuing warnings that the climate system in general could have "tipping points" (more formally, "critical thresholds"). In 2001 an IPCC report had suggested that warming might trigger irreversible "large-scale discontinuities," but the experts at that time had seen little risk of that happening unless the planet warmed 5°C or more above the pre-industrial level. As the years passed they had grown less confident. With the science of ice movement far from settled, nobody could be sure how fast an ice sheet might disintegrate. Key processes such as the way ice slid across underlying rock and mud remained maddeningly hard to determine by theory, computer modeling, or observation. Other processes that had seldom been connected with ice movements at all, from the viscosity of the deep bedrock to ozone in the upper atmosphere, turned out to matter. (For viscosity, the bedrock under West Antarctica was rising faster than expected as the weight of ice pressing it down diminished; in the short run, that could help keep the ice sheets grounded, but in the long run, rising bedrock might add to sea-level rise to a surprising degree. Meanwhile the "hole" in ozone above Antarctica and other human influences seemed to be changing the wind patterns that were pushing ocean water to melt the ice from underneath.).(35) | |
| Hardy scientists mounted new expeditions to puzzle out what could be happening. More people had stood on the Moon than on the Thwaites Glacier until 2019, when teams swarmed in, braving violent storms, to probe the ice from top to bottom. They even sent a robot submarine under the floating sheet to see whether warm seawater was reaching as far as the grounding ridges that pinned the ice, and melting it. Yes, it was. They found the ice breaking up under their feet. As one ice expert ruefully remarked, "The motto for early 21st Century cryospheric science might be, 'that happened faster than I thought it would'." | |
| A group that put together a variety of evidence and surveyed expert opinion estimated that the point of no return for a WAIS collapse might have been passed already, but was most likely to be passed in a decade or so (when mean global temperature was expected to reach some 1.5°C above the pre-industrial average). Given the many uncertainties, however, the critical threshold might never be passed if the rise could be held below 3°C. Once the collapse began, they figured it could run to completion in as little as 500 years, although several thousand years seemed more likely.(36) | |
| All this work was focused on West Antarctica. Everyone thought the vastly greater masses of ice in East Antarctica would be stable, thanks to the region's extreme cold. Indeed the experts had expected that on balance the continent would retard sea-level rise, by gaining ice through increased snowfall from a warmer and moister atmosphere. However, satellite data published in 2009 suggested that East Antarctica might already be losing ice. Expeditions now forced their way into the almost impenetrable region. They found evidence that the underlying topography, as in West Antarctica, could allow massive amounts of ice to collapse — and that this had in fact happened in previous interglacials. "East Antarctica is not as stable as we thought," a glaciologist lamented. In 2022 experts were surprised again when a large ice shelf in the region did disintegrate, prompting an expert to worry that "the sleeping giant that is East Antarctica" might awaken. Researchers estimated that a point of no return might be passed if global warming went more than 2°C above the pre-industrial average, and would most likely be passed if warming exceeded 3°C | |
| If an Antarctic tipping point was passed, it would take a long time to melt so much ice. Calculations with ice-sheet models generally saw a manageable sea-level rise between now and 2100. Studies that calculated another century or so ahead, however, found that greater losses of ice were likely, perhaps unavoidable. It was telling that in previous geological eras when the CO2 level had been no higher than it reached by 2020, global sea levels had wound up tens of meters higher than now. That was much higher than any model could simulate. "Lots of people have been scratching their heads trying to figure out what is missing from our ice sheet models," an expert remarked. No matter: news reports and technical discussions about sea-level rise usually stopped short at 2100, and policy-makers gave no thought at all to more distant problems.(37) | |
| Even for the present century, a pair of researchers warned that projections of sea-level rise might be too low, because "ice-sheet models lack representation of important physical processes." A mass of floating ice the size of a small nation seemed endlessly complex. For example, when an expedition discovered warm seawater intruding under the Thwaites glacier, modelers had to struggle to incorporate the new force for instability. Further unwelcome news came from a team that pointed out the potential for a "self-sustaining retreat" in yet another inaccessible region that had been mostly overlooked, the Wilkes Basin. Like the now notorious Thwaites (dubbed the "Doomsday Glacier" by journalists), the Wilkes glaciers held back enough ice to raise sea level 3 meters or so.(37a) | |
| Even before the new results came in from Greenland and Antarctica, some scientists had been worrying that the sea-level rise by 2100 might be double the 2007 IPCC report's conservative estimate of half a meter. The latest results made scientists still less willing to rule out the possibility of a rise of one meter or even two. A variety of geological records showed past abrupt rises within the space of a century or so. In particular, there was disturbing information from the Eemian interglacial, the closest analog to conditions expected late in the century. There had been at least one interval in the Eemian when the seas abruptly rose a couple of meters. In its 2021 report, the IPCC admitted that a rise of roughly a meter was indeed likely by 2100 — and a high-end scenario of a two-meter rise (plus far more in the following centuries) "cannot be ruled out." A 2025 review of satellite images found that over the past three decades, glaciers had lost ice along about a third of the Antarctic coastline, mainly where warmer water was getting in underneath (Thwaites, for example, had retreated 26km, Pine Island 33km).(38*) |
=>Impacts <=>Rapid change |
| Backing this up were comprehensive international studies that found Antarctica and Greenland losing ice faster than ever. The rate of ice loss in West Antarctica had tripled from the late 20th century to 2017. For the entire continent the rate had multiplied sixfold since the 1980s, with East Antarctica "a major contributor." However, it was Greenland that was largely responsible for the recent acceleration of sea-level rise.In August 2012 the entire surface of the Greenland Ice Sheet was seen to be melting, with pools everywhere (and the pools, darker than the snow surface, would absorb still more sunlight). A signal was emerging beyond the natural variability; a 2018 study showed the Greenland melting was faster than anything in previous centuries, and accelerating. Another study found that glaciers draining southern Greenland had sped up into a "new dynamic state" which would persist even if temperatures declined. Even in North Greenland, which experts had thought too cold to melt anytime soon, ice shelves that held back huge glaciers were collapsing. A drilling team fought the ferocious North Greenland weather to find that just 7,000 years ago, during an Arctic warming spell similar to the temperatures expected there around 2100, a substantial part of the ice had melted away to expose bedrock. The decay of the great ice sheet, another researcher declared, had passed the "point of no return." |
|
| A more conservative and more comprehensive study estimated that the threshold for Greenland Ice Sheet collapse might indeed have been passed already in the 2010s, but the authors believed the point of no return was most likely to be passed in another decade or two, when mean global temperature was expected to persistently exceed 1.5°C above the pre-industrial level. At best the process might become irreversible only if the warming got to 3°C. Once a collapse began, they figured it could be completed in as little as a thousand years, although ten thousand seemed more likely.(39) | |
More immediate worries were raised by news that the Arctic Ocean ice pack was shrinking far more rapidly than any model had predicted, dwindling to an extent unprecedented in thousands of years. The ice was dwindling not only in area but, still more, in thickness and thus in total volume. News media reported speculations (never actually published in a scientific journal) that the entire ocean would be ice-free within a few decades. By 2007 scientists did predict that a "Northwest Passage" across northern Canada would be ice-free in summer decades earlier than expected — and in 2016 a luxury cruise ship indeed made the trip. A few years later the Northeast passage along the Siberian coast opened to a rapidly expanding maritime traffic. |
=>Public
opinion |
| The disappearance of floating ice would not raise the sea level, of course. But it would let the Arctic Ocean absorb more sunlight and warm faster. That would not only accelerate global warming, but change weather patterns around the Northern Hemisphere (there were indications that the patterns were indeed changing, and not for the better). The unexpectedly early shrinking confirmed not only that the ice component of the climate system was poorly understood, but that our ignorance of ice was concealing mechanisms that could bring rapid changes.(40) | |
| On the other hand, people who wished to deny that global warming was a problem pointed to the sea ice around Antarctica. In the few decades it had been monitored its area had expanded. To be sure, the increase was irregular and of slight magnitude, nothing like the spectacular dwindling of both the extent and the thickness of the Arctic ice pack. But the expansion was puzzling. Computer modelers struggled to understand the many forces influencing Antarctic sea ice. Alongside normal long-term cycles in the oceans, global warming was bringing changes in wind patterns and ocean currents, and even in the salinity of the seawater as the melting glaciers of Antarctica dumped ever-larger volumes of freshwater into the sea. The situation was so complex that a leading computer modeling team had even predicted back in 1991 that during the early decades of global warming, the Southern Ocean would not warm up at all. In any case, the disingenuous claim that changes in Antarctic sea ice disproved the existence of global warming collapsed altogether in 2017 when the ice area abruptly shrank to a record low. In later years the area kept on shrinking, so dramatically that a 2023 study argued that global warming had brought a "regime shift" in the Antarctic ice pack.(41) | |
| One thing was certain. As temperatures climbed, the sea level would rise simply because water expands when heated. This is almost the only thing about global change that can be calculated directly from basic physics. The additional effects of glacier and ice sheet melting remained problematic, with experts still arguing over how much of the 20th century’s sea-level rise was due to heat expansion and how much to ice melting. In 2025 researchers added another and surprising component: as global warming advanced, soils were drying out around the world, and the missing water wound up in the oceans. In a severe global drought year this added as much as Greenland ice melt to sea-level rise. | |
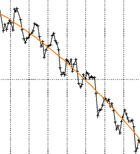
| The overall trend gradually became apparent, and were pinned down after 2000 by satellite measurements: the rate of sea-level rise was accelerating. Since the early 1990s the sea level had been rising three times faster than at any point since records began in the 1880s, and the rise was continuing to accelerate; by 2023 the rate of rise was double the rate seen just three decades earlier. Several lines of evidence showed that the rise over the past century was beyond anything seen for thousands of years if not tens of thousands. Shooting up on graphs like the blade of a hockey stick, the sea-level rise was increasingly recognized as responsible for a large part of the coastal flooding that had begun to endanger communities on the East Coast of the United States and in low-lying Pacific Ocean atolls.(42) |
|
| How bad could it get? For decades some senior glaciologists and other climate experts had warned that it was a mistake to concentrate on what seemed most probable. What about processes that, although perhaps not likely, would be catastrophic if they did come to pass? Ignoring an unknown did not make it go away. | |
| The IPCC tried to respond to the criticism in its next major report, issued in 2013. The authors projected a sea-level rise that ranged from 0.3 meter (if the world promptly launched vigorous emission reductions) to one meter (with unrestrained emissions). These were conservative limits for what was "likely," and the panel excused itself by saying that "there is currently insufficient evidence to evaluate the probability of specific levels above the assessed likely range." They did concede a possibility that the West Antarctic Ice Sheet would start to collapse, bringing the rise in 2100 as high as 1.5 meters. The next IPCC report, in 2021, increased this to 2 meters. |
|
| The rise would get progressively worse in the following centuries. No matter what happened elsewhere, a collapse of this one ice sheet would eventually submerge the world's coastal cities. The IPCC addressed that question for the first time in its 2021 report, suggesting that by 2300 a rise as great as 7 meters, while unlikely, was not impossible. To be sure, few people concerned themselves with so distant a future. | |
| As for people now alive, some experts thought even a 2-meter rise by 2100 might be an underestimate of what could happen. Computer models of ice sheets grew ever more complex, yet they were still a long way from capturing all the permutations of moving ice. For example, in 2011 a pair of scientists suggested that as the West Antarctic Ice Sheet melted back it would expose soaring ice cliffs, so high that they would collapse into the ocean under their own weight. That would expose new cliffs which might progressively collapse all the way back in a matter of decades. Researchers flocked to study the proposed mechanism, deemed important enough to get its own acronym, MICI (Marine Ice Cliff Instability) |
<=>Rapid change
|
| A few years later a prestigious group of scientists warned about still other unexpected processes that might bring a sea-level rise of several meters before the end of the century; equally good scientists disparaged the proposition as gross speculation. For example, in 2025 a team invoked an unexpected process they called "ice-plain instability" to explain a sudden glacial collapse on the Antarctic Peninsula, Over a couple of months the ice had retreated "nearly an order of magnitude faster" than anything seen before. Could that happen to the Pine Island and other glaciers? The constant churn of controversial new ideas showed (as a journalist noted) "just how far from resolved, scientifically speaking, the question of danger level remains." Experts did agree that it was now all but impossible to prevent sea levels from rising high enough to endanger coastal cities. The question was whether that would happen over centuries, or decades.(43*) | |
| Storms, Floods, and the Future TOP OF PAGE | |
| Civil engineers had warned for decades that New Orleans was at risk from hurricanes. Some had pointed out that the chance of disaster would mount as global warming raised the sea level, and perhaps made storms stronger. These speculations broke into the news after Hurricane Katrina flooded the city in August 2005, driving more than a million people from their homes and killing some 1,500 who would not or could not evacuate. Experts asked whether Katrina would have been so devastating if the heat in the Gulf of Mexico's waters — a main source of the storm's energy — had not been higher than normal? Scientists were not yet able to answer that kind of question for a single event. The important question was not what global warming did in one case, but what it would mean for the future probability of terrible hurricanes and typhoons. |
|
| Scientists had only a sketchy idea of how tropical storms worked. Nevertheless, when the 21st century began, nearly all experts had been confident that tropical storms would not become seriously worse for many decades. Even Kerry Emanuel, who had explained in 1987 how a warmer sea surface would provide energy for greater storms, had not expected a noticeable change anytime soon. But he had analyzed decades of data on tropical storms and saw a disturbing trend. While the number of hurricanes and typhoons had not been increasing, the intensity of the worst storms seemed to have climbed in recent decades. The rapid increase in destructive power, so different from what experts had expected, correlated surprisingly well with the observed rise of sea-surface temperatures. "For the first time in my professional career," Emanuel recalled, "I got alarmed." In August 2005 he published a warning of gathering danger, reinforcing a previous warning by another expert, Kevin Trenberth, that "hurricanes are changing." The papers attracted widespread attention when Katrina struck three weeks later.(44) |
|
| Meanwhile a separate group had gotten similar results. Other meteorologists stuck by their earlier conclusions. A fervent, sometimes personal controversy broke out. The experts of the old school insisted that the record of tropical storm intensities was only guesswork for most of the 20th century, especially in the vast, unvisited spaces of the Pacific. If there had indeed been a change in recorded hurricanes, they suggested it only reflected a phase in a decades-long natural climate cycle already known in the North Atlantic. Later studies disputed this, but in any case a few decades of weather in one region said little about long-term global trends. Computer models varied, some projecting little change in the intensity of great tropical storms, others projecting a modest increase by the end of the century. Many observers felt that scientific understanding was so limited that, as one group concluded in 2007, “the question of whether hurricane intensity is globally trending upwards in a warming climate will likely remain a point of debate in the foreseeable future.” |
|
| However, starting in 2010 persuasive studies with the ever more powerful computers calculated that Katrina-like events should become increasingly likely as the oceans warmed. A 2016 review concluded that while the total number of tropical cyclones might not change, the most intense ones (categories 4 and 5) were likely to come more frequently. And according to a global survey of satellite photos, there had indeed been a steady increase since 1982 in the number of categories 3, 4 and 5 tropical cyclones. Later studies asserted that the weaker storms too had been getting stronger. In the mid 2010s a few people began to speculate that we might eventually need to add a new "category 6" to describe the greatest storms; in 2024, with several storms in the past decade already exceeding the proposed threshold, two experts published a formal proposal to do just that. However, many experts withheld judgment. They said the high variability in storms over decades, and the lack of hard data for large parts of the oceans before satellites began to survey the globe, made it premature to claim that any effects of climate change had been detected. |
=>Impacts |
| One observation many found plausible was that tropical cyclones in every ocean were tending to move more slowly, causing greater damage as by lingering over a region. Some computer models of global warming had predicted that, but nobody had anticipated that storms might also intensify suddenly, catching people unprepared. The problem was dramatized in 2017 by Hurricane Harvey, which surged from category 1 to category 4 in less than two days and then stalled, drowning Houston, Texas in days of torrential downpours. In 2019 Hurricane Dorian lingered catastrophically over Grand Bahama Island, in 2022 Ian surged from category 1 to near category 5 within a day before smashing into Florida, and in 2023 Otis took Acapulco disastrously by surprise when it leaped from a humdrum tropical storm to a category 5 hurricane within 12 hours. That was a few days after publication of a statistical study of Atlantic hurricanes which reported that storm intensification was happening twice as often as a few decades earlier. Experts worried that the ever warmer sea surfaces were encouraging intensification, but it would take more evidence and study to know what was happening. For example, human pollution undoubtedly had some kind of effect on clouds and perhaps wind patterns; it was an open question what would happen as restrictions on pollution tightened. Some things were clear: at a given hurricane strength, rainfall was more intense (since the warmer air held more moisture) and coastal flooding was worse (because of sea-level rise). (45*) | |
| As for other kinds of storms, outside the tropics, computer models differed on whether the winds would get stronger, but they agreed that storm tracks would shift. That would inflict sudden floods on places not prepared for them. Worse, it had long been understood that because warmer air holds more moisture, global warming would intensify the water cycle: there would be more rainfall in some regions and less in others. Usually this was presented in maps showing changes in average rainfall. But computer studies in the 1990s suggested that the situation would in fact be worse — much of the additional rainfall would come in a few especially violent storms. For example, in 1997 a group reported that with warming, "The probability of heavy daily precipitation increases by more than 50% in many locations." Experts had little confidence in these computer models, however, which could not make a computation in reasonable time without dividing the planet into cells that were too large to resolve individual storms. It was an open question how far the risk of extreme downpours might increase. |
|
| In the early 2000s more powerful computers began to give more definite predictions. Much of the extra rainfall would indeed be concentrated in a few erratic and catastrophic flood events. A 2017 study estimated that by 2100, the worst rainfall events would become ten times more frequent in most regions. (Meanwhile observations showed both droughts and extreme flood events were in fact increasing globally.) On a broader scale, not only would wet regions get wetter and dry regions drier, but in a given river basin there would be more intense wet years, with worse flooding, between longer dry periods with worse droughts. "Things will be completely nuts by the end of the century," an atmospheric scientist warned, "if we keep doing what we're doing now."(46) For regional flooding, droughts, and other prolonged extreme events see the essay on Impacts. | |
| As understanding grew of how storms formed, of how global warming might affect the Northern Hemisphere jet stream, and so forth, while unprecedented weather disasters multiplied, experts began to renounce their traditional plea that it was not possible to attribute any single weather anomaly to climate change. In the 2010s they began to calculate how this particular hurricane or that particular season of downpours had been made thus-and-so much worse because of global warming. In some cases, a lot worse. Experts grew increasingly confident that climate change was bringing increased damage from local floods due to particular storms like Hurricane Harvey. On a larger scale, computer models projected that the rising level of moisture in the atmosphere would severely intensify "atmospheric rivers." These were long, narrow bands full of water vapor that inflicted dangerously prolonged downpours on California, Europe, and East Asia. |
<=>Impacts |
| The problem of prolonged seasonal flooding across large regions — rivers rising week after week, driven by melting snowpack or a series of storms — was less certain. Such floods are complex events influenced by changes in land use, construction of levees, and many other things. Contrary to expectations, on average there was no global increase of these floods. Scattered evidence suggested that large-scale floods were becoming less common in dry regions, but more frequent and worse in wet regions. According to a 2022 study, greater flooding in places where rainstorms were becoming more extreme was offset by less flooding in places where the main problem came from spring snowmelt, which was diminishing. Extraordinarily damaging seasonal inundations might alarm the public, but the net effect of climate change was ambiguous.(47) | |
| On the other hand, the undeniable rise of sea level meant that storms like Sandy, which flooded parts of New York City in 2012, were already causing tens of billions of dollars more losses than if the oceans had not warmed and risen higher. A 2017 study found that flooding from such a storm surge, formerly a 1 in 500 years event, by mid century would probably be a 1 in 5 years event. In addition, ambiguous geological evidence raised speculation that a hotter climate might hit coasts with "superstorms" far greater than anything seen in historical times. The very uncertainty was a call to action. If there was a serious risk of such devastation, it was not something we should leave for the next generation to deal with.(48) |
|
| What happens if we get a modest one meter of sea-level rise by the last decades of this century? That might not sound like much, but in many areas it would bring the tides inland a hundred meters or more (a few hundred feet). Such a rise would bring numerous everyday problems — salinization of aquifers, periodic blockage of coastal roads, eradication of sandy beaches and of marshes vital to wildlife and fisheries, etc.— along with occasional storm-surge catastrophes that could drive millions of refugees out of populous coastal areas from Shanghai to Miami. Entire island nations are at risk. Then it will get worse. Even if humanity could bring its greenhouse emissions to a full stop, the gases already in the air will capture heat energy that will work its way gradually deeper into the oceans. Simple thermal expansion of seawater will make the tides creep higher, century after century. |
|
| The main problem, however, is ice. In 2018 an IPCC report acknowledged that an irreversible collapse of Antarctic ice shelves,or the Greenland Ice Sheet, or both, might be triggered even before global warming reached 2°C. Surveying subsequent research, a 2025 review concluded that the tipping points for both the WAIS and Greenland ice sheets had most likely already been passed around 1.2°, and sea levels were doomed to rise at a rate "that would stretch the limits of adaptation".(49) Meanwhile, surveys showed that the great polar caps were dwindling on a trajectory that matched the upper limit of the IPCC's worst-case scenarios. The rate of melting "has accelerated faster than we could have imagined," a leading glaciologist admitted. A group of top experts declared that if the planet warmed up more than another three degrees — which was likely unless the world swiftly imposed severe restrictions on emissions — the models could not be trusted, and sea levels might rise much faster than the current worst-case scenarios.(50) |
|
| It was beginning to look more likely than not that
it was already too late to arrest the forces melting polar ice. Eventually, probably over several thousand years, large parts of the great ice sheets will have dissolved into the oceans. There were distant geological ages when the carbon dioxide level in the Earth’s atmosphere reached 500 ppm, a level human emissions could bring within decades. In those "hothouse" ages not only Greenland’s ice but much of Antarctica’s had melted, raising the sea level tens of meters. Strenuous efforts to reduce emissions, and eventually to extract carbon dioxide from the atmosphere, might allow most of Antarctica and northern Greenland to survive. But only a prompt and massive reorganization of the world's energy systems can prevent the disintegration, within a few centuries if not sooner, of enough of the West Antarctic and Greenland Ice Sheets to raise the oceans several meters or more. For posterity that will be the grandest, but
unwelcome, monument of our civilization.(51)
See the summary of expected Impacts of Climate Change. |
=>Impacts |

 Eric Rignot

RELATED:
Home
Impacts of Climate Change
Rapid Climate Change
The Public and Climate
| NOTES |
1. Christina L. Hulbe, "Are you pondering what I'm pondering? Time and change in the West Antarctic Ice Sheet," abstract of lecture, American Geophysical Union meeting, Dec. 13, 2016. BACK
1a. Gladwin Hill, "Warming Arctic climate melting glaciers faster, raising ocean level, scientist says," New York Times, May 30, 1947. For 1957 (Revelle and Teller) see the essay on Impacts. Ewing and Donn (1956a); Budyko (1962). BACK
2. Glaciers as "sensitive indicators of climate" are stressed in the pioneering theoretical treatment of surges, Nye (1960). BACK
3. "The chief conclusion of this paper is that the greatest glacial fluctuations in Antarctica were produced by changes in sea-level." The paper was motivated by the idea that the timing of Antarctic glacial movements was set by sea-level changes that reflected Northern Hemisphere glaciation. Hollin (1962), p. 174. BACK
4. Wilson (1964); Wilson (1966); Wilson (1969); Wilson's starting-point was the suggestion that the center of Antarctica was at the pressure melting point, see Robin (1962), p. 141, who adds that "one would not expect the ice to surge over a large part of Antarctica at one time"; the role of frictional heat in ice-sheet instability was pointed out back in 1961 (in partial support of Ewing-Donn theory), drawing on earlier work by G. Bodvarsson, by Weertman (1961). BACK
5. Hollin (1965), quote p. 15. BACK
6. On early Antarctic ice research in general see Oppenheimer et al. (2019). Mercer's basic argument was that "fringing ice shelves... will rapidly disintegrate by calving if the average temperature of the warmest month rises above freezing point," Mercer and Emiliani (1970); see Mercer (1968) ; North Atlantic: Mercer (1969); meanwhile a suggestion about a more gradual disappearance of the Greenland Ice Sheet was advanced by Emiliani (1969); earlier, Robin and Adie (1964), said that catastrophic deglaciation of West Antarctica was "unlikely, but not necessarily impossible," p. 117. Later calculations (about 3.2 meters): Bamber et al. (2009). For the history of WAIS research see Thomas (2014). BACK
7. W.J. Campbell in discussion of Wilson (1969), p. 915. BACK
8. Data were analyzed by Hughes (1973); Weertman (1974), "entirely possible," p. 3; the classic theory was Thomas (1973a); and Thomas (1973b); Flohn (1974) gave a more general model; on ice modeling, see also Hughes (1977). Google's nGram Viewer shows use of "cryosphere" in books began to rise ca. 1975. BACK
9. Emiliani et al. (1975); see Science (9/24/76): 1268 for criticism. Quote: Emiliani (1980), p. 87. BACK
10. E.g., Calder (1975); note also the semi-popular article: Emiliani (1980). BACK
11. Hughes (1977); Hughes et al. (1977); Thomas and Bentley (1978). BACK
12. Mercer (1978), quotes pp. 321, 325. On Mercer see Broecker and Kunzig (2008), p. 147. BACK
13. Elliott (1977-89), vol. 1, 4/8/79. BACK
14. Thomas et al. (1979), p. 355. BACK
15. E.g., Herterich (1987). BACK
16. Revelle (1983), see Oppenheimer et al. (2019). Similarly Thomas et al. (1979); Bentley (1980) saw a possible ice sheet collapse in the next 500 years; but Bentley (1982) said melting could take thousands of years; this was disputed by Hughes (1982); Hollin (1980) tried to demonstrate an East Antarctic ice sheet surge about 95,000 years ago; for predictions of meter-scale rises, see Jones and Henderson-Sellers (1990), pp. 10-11, 15; a skeptic: van der Veen (1985); van der Veen (1988). BACK
17. IPCC (2001a), pp. 657-58; IPCC (2014b), pp. 1145-50. BACK
18. Etkins and Epstein (1982); Gornitz et al. (1982); an influential model-based calculation: Cubasch et al. (1992). BACK
19. "Most workers" project 0.5-1.5m rise in next 50-100 years if warming continues, according to Schneider (1989b), p. 777; he cites i.a. Meier et al. (1985); this range was taken as plausible for 2100 in National Research Council (1987); but only a few cm rise by 2025 according to the most cited of these papers, Wigley and Raper (1987). BACK
20. "Daunting:" Wigley and Raper (1987), p. 131. “Policies:” David Burns in AAAS (American Association for the Advancement of Science), Conference Proceedings. The Response of the West Antarctic Ice Sheet to CO2-induced Climatic Warming, Orono, ME, April 1980, p. 218, as quoted in Oppenheimer et al. (2019), p. 136, see p. 151. BACK
21. Barclay Kamb quoted by Walker (1999); the slippage was predicted by Blankenship et al. (1986). For this and other history see Bindschadler and Bentley (2002). BACK
22. Later work confirmed Antarctic ice as the source: Clark et al. (2002); Weaver et al. (2003); "debate": W. Sullivan, New York Times, May 2, 1995, p. C4. 16m rise: Bard et al. (1990); Hanebuth et al. (2000). Workshops: O'Reilly et al. (2012), p. 714. For all this see Thomas (2014) BACK
23. Doake and Vaughan (1991); Rott et al. (1996). BACK
24. Mercer (1978), p. 325; Vaughan and Doake (1996). BACK
24a. Notably models by Philippe Huybrechts, see O'Reilly et al. (2012), p. 715. BACK
25. Oppenheimer (1998); IPCC (2001a), pp. 678-79; "Unsolved Problem" was the title of Weertman (1976b); repeated in Van der Veen and Oerlemans (1987), p. 14. BACK
26. Thomas (1993), p. 398; Oerlemans (1994); Dyurgerov and Meier (2000); Oerlemans (2005) surveyed glacier records around the world and found that "for the period from 1900 to 1980, 142 of the 144 glaciers retreated"; see review by Alley et al. (2005). BACK
27. NOTE that the papers I cite throughout this section are only examples of numerous papers by these and some other authors. A readable summary is in Broecker and Kunzig (2008), pp. 152-56. "Wake-up call:" Helen Fricker in Benningfield (2023). Crevasse wedging: Doake et al. (1998), van der Veen (1998), Scambos et al. (2000). Ice base melting: Rignot and Thomas (2002), "most important finding," p. 1505. Subsequent work pointing in the same direction included De Angelis and Skvarca (2003), who found that Antarctic grounded ice surged after an ice shelf breakup, and Bindschadler et al.(2003), who reported that a major West Antarctic ice stream started and stopped flowing as the tide went up and down. Larsen acceleration: Rignot et al. (2004), Scambos et al.(2004) (who also note lubrication by percolating water, see following note). WAIS models: Payne (2004); observed WAIS changes: Thomas (2004), Siegert (2004). Several papers by Rignot and colleagues document other Antarctic changes. "A lot shorter:" Robert Bindschadler in Larry Rohter, "Antarctica, Warming, Looks More Vulnerable," New York Times, 25 Jan. 2005, section D. See Holmes (2004) for discussion. BACK
28. Vaughan and Arthern (2007). BACK
29. Classic models: notably Huybrechts (1990). The grids in current models are still too coarse to simulate ice streams. IPCC (2001a), pp. 641-42, projected between 0.1 and 0.9 m rise including ice melting; IPCC (2007b), p. 13 projects 0.2 to 0.6 m explicitly excluding possible ice change surprises. See also Meehl et al. (2005), O'Reilly et al. (2012). On claims of political interference in the IPCC final report see Pearce (2007a) and response by Piers Foster et al., Letter, New Scientist (March 24, 2007), p. 26. I also draw here on my own conversations with glaciologists. See Oppenheimer et al. (2007); Susan Solomon et al. and Michael Oppenheimer et al., Exchange of Letters, Science 319 (2008): 409-10; Oppenheimer et al. (2019). Official report: U.S. Climate Change Science Program) (2008), p.9. BACK
30. Concern about Greenland glacier surging was spurred by Krabill et al. (1999). Lubrication: Zwally et al. (2002). For discussion see, e.g., Schiermeier (2004) and Bindschadler (2006). Darkening (notably by melt pools): Curry et al. (1995). "Mechanism:" Shepherd et al. (2004); for water percolating through the ice see Phillips et al. (2013). Front-end mechanism: Hughes (1986). Hansen raised the question of iceberg armadas, see this website's essay on rapid change and went so far as to call the Greenland ice a "ticking time bomb:" Hansen (2005), p. 275. For the rapid rise at the end of the last ice age see note 22. BACK
31. Greenland ice stream acceleration: e.g., Rignot and Kanagaratnam (2006), also, small earthquakes in Greenland, caused by sliding glaciers, had become twice as frequent: Ekström et al. (2006). Slowdown: Howat et al. (2007). Mass loss: e.g., Chen et al. (2006); Luthcke et al. (2006); Zwally et al. (2005); another satellite: Pritchard (2009). Accelerating: Rignot et al. (2008); Velicogna (2009). A more recent study showing substantial mass loss: Csatho et al. (2014). 1940s: Frederikse et al. (2020). Greenland 400,000 years ago: Reyes et al. (2014); entirely melted: Bierman et al. (2024). BACK
32. Denton and Hughes (1981), p. 431; "underbelly": Hughes (1981), Hughes (1982). Pine Island Bay is also known as the Amundsen Sea Embayment or Amundsen Basin. BACK
33. Most effective tool: Vaughan (2008), p. 71. Rignot (1998), called a "landmark paper" by Shepherd et al. (2018a), q.v. for a historical review of satellite studies of Antarctic ice. Another group: Wingham et al. (1998). BACK
34. "Don't really know:" Andrew Shepherd on BBC News, Aug. 13, 2009, online here; Wingham et al. (2009); Greenland: NEEM community members (2013); however, much of the Greenland ice had melted away in some warm period in the past million years, Christ et al. (2021). Ingenious study (using DNA from museum octopus specimens): Lau et al. (2023). Irreversible: see Favier et al. (2014); Rignot et al. (2014); Joughin et al. (2014); Rignot quote: Justin Gillis and Kenneth Chang, "Scientists Warn of Rising Oceans From Polar Melt," New York Times, May 12, 2014, p. 1. If the Pine Island region glaciers collapsed, another computer study found, all of West Antarctica would "irrevocably" follow, raising sea level three meters or more: Feldmann and Levermann (2015). BACK
35. IPCC (2001b) ("burning embers" diagram, p. 11). On unreliability of models see O'Reilly et al. (2012), pp. 721-22; 'there is still no robust, credible model for the interaction of melting ice sheets with the ocean," Holland and Holland (2015). Slid across: e.g., Stearns and van der Veen (2018). Bedrock viscosity: Barletta et al. (2018), Pan et al. (2021); sea-level effects of rebound under different emission scenarios were calculated (via mantle viscosity) by Gomez et al. (2024), see also Golledge (2024). Ozone: Holland et al. (2019). BACK
36. Melting underneath: Rignot and Jacobs (2002); Konrad et al. (2018); expedition: Wåhlin et al. (2021), Voosen (2021c); McConnochie (2023). Motto: Christina L. Hulbe, see note 1 above; similarly, redefining "glacial pace," Benningfield (2023). Threshold estimates: Armstrong McKay et al. (2022). BACK
37. Chen et al. (2009); an increase 1992-2008 reported by Zwally et al. (2015) was widely publicized but disagreed with other studies, see Pritchard et al. (2009), also, e.g., Young et al. (2011), Mengel and Levermann (2014), Rintoul et al. (2016), Scambos and Shuman (2016), Qiu (2017); little snowfall accumulation in Antarctica as a whole: Eswaran et al. (2024); not as stable:" Isabella Velicogna referring to Wilson et al. (2018), email quoted in Chris Mooney, "At this Rate, Earth Risks Sea Level Rise of 20 to 30 Feet, Historical Analysis Shows," Washington Post (Sept. 20, 2018), online here. For an individual East Antarctica ice stream at risk see Brancato et al. (2020). Conger–Glenzer ice shelf loss, "sleeping giant:" Alley (2024). Point of no return: Stokes et al. (2022), Armstrong McKay et al. (2022). Only after 2100: Seroussi et al. (2024), for Thwaites see also Morlighem et al. (2024). "Scratching their heads:" Alex Bradley, quoted in Sachi Kitajima Mulkey, "Scientists Just Got Closer to Solving a Major Antarctic Puzzle," Grist, Jun 28, 2024, online here. BACK
37a. "Lack representation:"Bradley and Hewitt (2024), see also Rignot et al. (2024). Wilkes Subglacial Basin: Dawson et al. (2024). Thwaites was given the sobriquet (which did not catch on until around 2021) by Jeff Goodell, "The Doomsday Glacier," Rolling Stone (May 9, 2017), online here. .BACK
38. Rapid sea-level changes (10 meters within 1000 years) were found in ancient coral reefs: Thompson and Goldstein (2005); Blanchon et al. (2009) found a "2–3-m jump in sea level" in a century, presumably due to ice sheet instability, during a period warmer than the 20th century. "A rise of over 1 m by 2100 for strong warming scenarios cannot be ruled out," Rahmstorf (2007), extended by Vermeer and Rahmstorf (2009), who project sea-level rise from 1990 to 2100 in the range 75-190cm. Reager et al. (2016) said the seas would have been rising even faster, except that soils were soaking up and storing more water from increased precipitation.The problem will be compounded in many river deltas (Ganges, Mississippi, Nile, etc.) by subsidence. Eemian sea-level rise: Hearty et al. (2007), WAIS deglaciation: Carlson et al. (2021). IPCC (2001b), p. 21 .30-year retreat: Rignot et al. (2026). .BACK
39. Antarctic ice loss: Shepherd et al. (2012). Ice sheet Mass Balance Inter-comparison Exercise (IMBIE), Shepherd et al. (2018b), see Shepherd et al. (2018a); "major:" Rignot et al. (2019). Greenland: Box et al. (2012), Chen et al. (2017), Khan et al. (2016). Acceleration of Greenland melting: Trusel et al. (2018), Mouginot et al. (2019), for West Antarctica Shepherd et al. (2019). "New dynamic state:" King et al. (2020), see also Tedstone and Machguth (2022) for expanding water-runoff area. North Greenland: Millan et al. (2023). drilling: Walcott-George et al. (2026). Point of no return: Ian Howat quoted in Max Claypool and Brandon Miller, "Greenland's Ice Sheet Has Melted to a Point of No Return, According to New Study," CNN.com (Aug. 14, 2020), online here. Threshold: Armstrong McKay et al. (2022); cf. Bochow et al. (2023), finding a threshold for "an abrupt ice-sheet loss" at 1.7 °-2.3 °C.. BACK
40. Striking decline in Arctic thickness: Kwok et al. (2009). Unprecedented: Brennan and Hakim (2022). Around 2007 the science-attentive media (Science, Nature, New York Times, etc.) began to cover extensively the sea-ice data compiled by the U.S. National Snow & Ice Data Center.. Speculations: see Gavin Schmidt, "But You Said the Ice Was Going to Disappear in 10 Years!" Realclimate.org, Sept. 21, 2015, online here. BACK
41. Southern Ocean cooling: : Manabe et al. (1991). Eric Steig, "Clarity on Antarctic Sea Ice," RealClimate.org, Dec. 19, 2014, online here, gives an overview with references. Later additions to the discussion include Armour et al. (2016), Meehl et al. (2016), Rye et al. (2020).On the inadequacy of sea ice models see Shu et al. (2020). Regime shift: Purich and Doddridge (2023), salinity: Silvano et al. (2025). BACK
42. Despite measurements of total heat absorbed by the oceans by Levitus et al. (2000) and Levitus et al. (2001), "20th-century sea level remains an enigma — we do not know whether warming or melting was dominant, and the budget is far from closed," according to Munk (2003). Church and White (2006); Hay et al. (2015); geological: Lambeck et al. (2014); Kopp et al. (2016a). Drying soils: Seo et al. (2025). On recent acceleration see Fasullo et al. (2016); three times faster: Dangendorf et al. (2017), continuing to accelerate: Dieng et al. (2017), Chen et al. (2017). The acceleration, at first controversial, was confirmed when an error in satellite calibration was corrected, see Watson et al. (2015), Tollefson (2017), Nerem et al. (2018), Dangendorf et al. (2019). Graphs of sea-level rise, ice, and other data may be found on the Columbia University Earth Institute data page. BACK
43.IPCC (2014a), pp. 25-26, IPCC (2021a), ch. 9; IPCC (2021b), Fig. SPM.8. For 2018 sea-level estimates see Bamber et al. (2019). Ice-cliff collapse: Bassis and Walker (2011) proposed the instability, see also Gudmundsson et al. (2012), Pollard et al. (2015); the chain reaction was modeled by DeConto and Pollard (2016), bringing wide publicity and skepticism but called a paradigm-shifting paper by Mann (2023), p. 175. [DeConto et al. (2021), also much cited, lowered the estimate for possible sea level rise in this century but still saw a "possibility that rapid and unstoppable sea-level rise from Antarctica will be triggered".] Wise et al. (2017); for theoretical objections see Edwards et al. (2019). Prestigious group: Hansen et al. (2016), published in draft as Hansen et al. (2015). An example of a refinement in modeling ice flow processes, which suggested ice streams could flow twice as fast as previous estimates: Robel et al. (2022). Glacier surge (in 2022) "order of magnitude faster:" Ochwat et al. (2025)..More examples, all in 2023: a computer team using an ocean model announced that the melting of ice shelves would accelerate, Naughten et al. (2023), while a team with an ice-flow model announced that nevertheless the Thwaites glacier would not accelerate soon, Gudmundsson et al. (2023) [disputed by subsequent observations of changes in cracks, Banerjee et al. (2025) ], and a team analyzing ice cores declared that all models deeply underestimated future warming in Antarctica, Casado et al. (2023). "Far from resolved:" Elizabeth Kolbert, "A New Climate-Change Danger Zone?," The New Yorker Daily Comment, July 23, 2015, online here. BACK
44. "For the first time" quoted Kunzig (2006), p.22. Emanuel (1987); Emanuel (2005a), published August 4, found that "longer storm lifetimes and greater storm intensities... correlated with [higher] sea surface temperatures." Trenberth (2005), published June 17. BACK
45. Webster et al. (2005) (Sept. 16) set out to refute Trenberth but found in all ocean basins "a large increase... in the number and proportion of hurricanes reaching categories 4 and 5." Also influential were a computer study, Knutson and Tuleya (2004), and Trenberth (2005). A more thorough study by Elsner et al. (2008) found that the maximum wind speed of the strongest tropical cyclones had been increasing. Satellite photos: Kossin et al. (2020). See also, i.a., Hoyos et al. (2006); Wu et al. (2006). Summary of models: Meehl et al. (2007), pp. 786-88. For the controversy: Pearce (2005b); Kunzig (2006); Witze (2006); Valerie Bauerlein, "Hurricane Debate Shatters Civility of Weather Science," Wall Street Journal, Feb. 2, 2006, p. 1; Emanuel (2005b); Mooney (2007a). Changes not due to a supposed Atlantic Multi-decadal Oscillation (AMO): Mann and Emanuel (2006); see this note in the essay on "Ocean Currents and Climate," a later study finding no connection between the recent Atlantic increase and global warming: Vecchi et al. (2021). "Remain a point of debate:" Kossin et al. (2007). “Greenhouse warming will cause the globally averaged intensity of tropical cyclones to shift towards stronger storms:" Knutson et al. (2010); Grinsted et al. (2013) projected "a twofold to sevenfold increase in the frequency of Katrina magnitude events for a 1°C rise in global temperature;" review: Sobel et al. (2016). All categories increase: model study, Bhatia (2018); observations: Wang et al. (2022). Category 6: Wehner and Kossin (2024). Cyclone slowdown: Kossin (2018). Intensification: Emanuel (2017), Balaguru et al. (2018), for attribution to global warming see Reed et al. (2022); Atlantic statistics, Garner (2023); Trepanier et al. (2024). Decline in aerosol pollution likely contributed to the increase in Atlantic hurricane activity after the 1970s: Murakami (2022). "Marked" intensification of rainfall: Liu et al. (2019); farther inland: Li and Chakraborty (2020). BACK
46. IPCC (1996a), p. 6; IPCC (2001a), p. 572; Palmer and Räisänen (2002), pdf online here. In a landmark paper,Trenberth et al. (2003) laid out fundamental physics reasons for fewer spells of light rain and more great downpours. . Precipitation: Hennessy et al. (1997), see also Trenberth (1998); ten times: Neelin et al. (2017); see also Pendergrass and Knutti (2018), Observations (2000-2021): Rodell and Li (2023). Worse wet/dry alteration: Ficklin et al. (2022). "Nuts:" Angeline Pendergrass, quoted in Witze (2018). BACK
47. An example of a model on extratropical storms predicting a rise in extreme precipitation events: Bengtsson et al. (2009). Atmospheric rivers: Zhang et al. (2024). Seasonal floods: Sharma et al. (2018) , Do et al. (2017) (not floods per se but maximum annual streamflow). Wet vs. dry regions: for Europe see Blöschl et al. (2019), for US see US Global Change Research Program, Trends in Flood Magnitude. Brunner et al. (2021) discuss how extreme events can depend on the character of the watershed. Storms vs. snowmelt: Zhang et al. (2022). BACK
48. One in 5 years: Garner et al. (2017). Superstorms: Hansen et al. (2016). For the cost of Sandy see this note in the essay on Impacts. BACK
49. Ice sheet instabilities: Garbe et al. (2020); Greenland: Pattyn et al. (2018); IPCC (2018) (Figure SPM.2, p. 7), see Lenton et al. (2019). Review: Stokes et al. (2025). BACK
50. "Faster:" Tom Slater, quoted in Dharna Noor, "Antarctica and Greenland Are on Track for the Worst-Case Climate Scenario," gizmodo.com Sept. 8, 2020, online here, referring to Slater et al. (2020), see Slater et al. (2021). Surveys: Shepherd et al. (2020).. Models untrustworthy: Alley et al. (2020). BACK
51. Commitment to sea level change is summarized in Meehl et al. (2007), p. 752. High middle Miocene CO2 and sea levels: Tripati et al. (2009). During the last interglacial before the present the sea level was probably 7-8 or more meters higher: Kopp et al. (2009); see also Dutton and Lambeck (2012), Dutton et al. (2015). Levermann et al. (2013) calculate "a sea-level rise of approximately 2.3 m/ °C within the next 2,000 years." Ice sheet retreat: Levy et al. (2016). BACK
copyright © 2003-2026 Spencer Weart & American Institute of Physics