The Carbon Dioxide Greenhouse Effect
In the 19th century, scientists realized that gases in the atmosphere cause a "greenhouse effect" which affects the planet's temperature. These scientists were interested chiefly in the possibility that a lower level of carbon dioxide gas might explain the ice ages of the distant past. At the turn of the century, Svante Arrhenius calculated that emissions from human industry might someday bring a global warming. Other scientists dismissed his idea as faulty. In 1938, G.S. Callendar argued that the level of carbon dioxide was climbing and raising global temperature, but most scientists found his arguments implausible. It was almost by chance that a few researchers in the 1950s discovered that global warming truly was possible. In the early 1960s, C.D. Keeling measured the level of carbon dioxide in the atmosphere: it was rising fast. Researchers began to take an interest, struggling to understand how the level of carbon dioxide had changed in the past, and how the level was influenced by chemical and biological forces. By 2000, computer calculations along with evidence from ancient climates showed unequivocally that human emissions of the gas were raising Earth's temperature. Attention turned to studying how the gas was emitted or taken up by natural systems as well as by humanity, how far the temperature would rise, and what could be done to avoid disaster by curbing emissions. (This essay covers only developments relating directly to carbon dioxide, with a separate essay for Other Greenhouse Gases. For theoretical understanding of greenhouse warming see the essay on Simple Models of Climate.)
To get an overview, start with Summary: the Story in a Nutshell and then come back here.
| Like many Victorian natural philosophers, John Tyndall was fascinated by a great variety of questions. While he was preparing an important treatise on "Heat as a Mode of Motion" he took time to consider geology. Tyndall had hands-on knowledge of the subject, for he was an ardent Alpinist (in 1861 he made the first ascent of the Weisshorn). Familiar with glaciers, he had been convinced by the evidence — hotly debated among scientists of his day — that tens of thousands of years ago, colossal layers of ice had covered all of northern Europe. How could climate possibly change so radically? | - LINKS -
For full discussion
see |
| One possible answer was a change in the composition of the Earth's atmosphere. Beginning with work by Joseph Fourier in the 1820s, scientists had understood that gases in the atmosphere might trap the heat received from the Sun. As Fourier put it, energy in the form of visible light from the Sun easily penetrates the atmosphere to reach the surface and heat it up, but heat cannot so easily escape back into space. For the air absorbs invisible heat rays (“infrared radiation”) rising from the surface. The warmed air radiates some of the energy back down to the surface, helping it stay warm. This was the effect that would later be called, by an inaccurate analogy, the "greenhouse effect." The equations and data available to 19th-century scientists were far too poor to allow an accurate calculation. Yet Tyndall, like Fourier, believed correctly that a bare airless rock at the Earth's distance from the Sun should be far colder than the Earth actually is. |
|
| Tyndall set out to find whether there was in fact any gas in the
atmosphere that could trap heat rays. In 1859, his careful laboratory
work identified several gases that did just that. The most important
was simple water vapor (H2O). Also effective
were carbon dioxide (CO2), although in the atmosphere the gas is only a few parts in ten
thousand, Hydrocarbon gases and even perfumes could also absorb the radiation. Just as a sheet of black paper will block more light than an entire pool of clear water, so a trace of CO2 or a hydrocarbon gas like methane (CH4) could strongly affect the transmission of heat radiation through the atmosphere.
(For a more complete explanation of how the so-called "greenhouse
effect" works, follow the link at right to the essay on Simple
Models of Climate.) |
|
| Tyndall would have reached his result faster if he had been aware of an obscure publication by an American painter and amateur scientist, Eunice Newton Foote. Three years earlier she had found that CO2 absorbs heat, simply by measuring the heating of a glass tube filled with CO2 and exposed to sunlight. Foote went on to speculate that if there had been a period when the atmosphere held more of the gas, the planet would have been warmer. The scientific community ignored the brief note from an unknown female in a scientific backwater, and Foote's experiment has only recently received attention.(1) Greenhouse Speculations: Arrhenius
and Chamberlin TOP OF PAGE |
|
| The next major scientist to consider the Earth's temperature was another man with broad interests, Svante Arrhenius in Stockholm. He too was attracted by the great riddle of the prehistoric ice ages, and he saw CO2 as the key. Why focus on that rare gas rather than water vapor, which was far more abundant? Because the level of water vapor in the atmosphere fluctuated daily, whereas the level of CO2 was set over a geological timescale by emissions from volcanoes. If the emissions changed, the alteration in the CO2 greenhouse effect would only slightly change the global temperature—but that would almost instantly change the average amount of water vapor in the air, which would bring further change through its own greenhouse effect. Thus the level of CO2 acted as a regulator of water vapor, and ultimately determined the planet’s long-term equilibrium temperature. (Again, for fuller discussion follow the link at right.) In the early 1890s the Stockholm Physics Society, always interested in the ice ages, discussed these matters. A member, Arvid Högbom, lectured in detail on the forces that might change the level of the gas in the atmosphere. The talk inspired Arrhenius to take a deep look. |
|
| In 1896 Arrhenius completed a laborious numerical computation which suggested that cutting the amount of CO2 in the atmosphere by half could lower the temperature in Europe some 4-5°C (roughly 7-9°F) — that is, to an ice age level. But this idea could only answer the riddle of the ice ages if such large changes in atmospheric composition really were possible. For that question Arrhenius turned to Högbom and his estimates for how carbon dioxide cycles through natural geochemical processes, including emission from volcanoes, uptake by the oceans, and so forth. Along the way Högbom had come up with a strange, almost incredible new idea. | |
| It had occurred to Högbom to calculate the amounts of CO2 emitted by factories and other industrial sources. Surprisingly, he found that human activities were adding CO2 to the atmosphere at a rate roughly comparable to the natural geochemical processes that emitted or absorbed the gas. As another scientist would put it a decade later, we were "evaporating" our coal mines into the air. The added gas was not much compared with the volume of CO2 already in the atmosphere — the CO2 released from the burning of coal in the year 1896 would raise the level by scarcely a thousandth part. But the additions might matter if they continued long enough.(2) (By recent calculations, the total amount of carbon laid up in coal and other fossil deposits that humanity can readily get at and burn is some ten times greater than the total amount in the atmosphere.) So the next CO2 change might not be a cooling decrease, but an increase. Arrhenius made a calculation for doubling the CO2 in the atmosphere, and estimated it would raise the Earth's temperature some 5-6°C (averaged over all zones of latitude).(3) | |
| Arrhenius did not see that as a problem. He figured that if industry continued to burn fuel at the current (1896) rate, it would take perhaps three thousand years for the CO2 level to rise so high. Högbom doubted it would ever rise that much. One thing holding back the rise was the oceans. According to a simple calculation, seawater would absorb 5/6ths of any additional gas. (That is roughly true over a long run of many thousand years, but Högbom and Arrhenius did not realize that if the gas were emitted more rapidly than they expected, the ocean absorption could lag behind.) Anyway temperatures a few degrees higher hardly sounded like a bad idea in chilly Sweden. Another highly respected scientist, Walter Nernst, even fantasized about setting fire to useless coal seams in order to release enough CO2 to deliberately warm the Earth's climate.(4*) | |
| Arrhenius brought up the possibility of future warming in an impressive scientific article and a widely read book. By the time the book was published, 1908, the rate of coal burning was already significantly higher than in 1896, and Arrhenius suggested warming might appear within a few centuries rather than millennia. Yet here as in his first article, the possibility of warming in some distant future was far from his main point. He mentioned it only in passing, during a detailed discussion of what really interested scientists of his time — the cause of the ice ages. Arrhenius had not quite discovered global warming, but only a curious theoretical concept.(5) | |
| An American geologist, T. C. Chamberlin, and a few others took an interest in CO2. How, they wondered, is the gas stored and released as it cycles through the Earth's reservoirs of seawater and minerals, and also through living matter like forests? Chamberlin was emphatic that the level of CO2 in the atmosphere did not necessarily stay the same over the long term. But these scientists too were pursuing the ice ages and other, yet more ancient climate changes — gradual shifts over millions of years. Very different climates, like the balmy age of dinosaurs a hundred million years ago, puzzled geologists but seemed to have nothing to do with changes on a human time scale. Nobody took much interest in the hypothetical future warming caused by human industry. |
|
| Skepticism (1900-1940s) TOP OF PAGE | |
| Experts could dismiss the hypothesis because they found Arrhenius's calculation implausible on many grounds. In the first place, he had grossly oversimplified the climate system. Among other things, he had failed to consider how cloudiness might change if the Earth got a little warmer and more humid. A still weightier objection came from a simple laboratory measurement. A few years after Arrhenius published his hypothesis, another scientist in Sweden, Knut Ångström, asked an assistant to measure the passage of infrared radiation through a tube filled with carbon dioxide. The assistant ("Herr J. Koch," otherwise unrecorded in history) put in rather less of the gas in total than would be found in a column of air reaching to the top of the atmosphere. The assistant reported that the amount of radiation that got through the tube scarcely changed when he cut the quantity of gas back by a third. Apparently it took only a trace of the gas to "saturate" the absorption — that is, in the bands of the spectrum where CO2 blocked radiation, it did it so thoroughly that more gas could make little difference.(7*) |
Angstrom |
| Still more persuasive was the fact that water vapor, which is far more abundant in the air than carbon dioxide, also intercepts infrared radiation. In the crude spectrographs of the time, the smeared-out bands of the two gases entirely overlapped one another. More CO2 could not affect radiation in bands of the spectrum that water vapor, as well as CO2 itself, were already blocking entirely.(8) | |
| These measurements and arguments had fatal flaws. Herr Koch had reported to Ångström that the absorption had not been reduced by more than 0.4% when he lowered the pressure, but a modern calculation shows that the absorption would have decreased about 1% — like many a researcher, the assistant was overconfident about the reliability of his measurements.(9*) But even if he had seen the 1% shift, Ångström would have thought this an insignificant perturbation; adding more CO2 to the atmosphere, he concluded, would have a negligible effect. He failed to understand that the logic of the experiment was altogether false. | |
| The greenhouse effect will in fact matter even if the absorption of radiation were totally saturated in the lower atmosphere. The planet's temperature is regulated by the thin upper layers where radiation does escape easily into space. Adding more greenhouse gas there will change the balance. Moreover, even a 1% change in that delicate balance would make a serious difference in the planet’s surface temperature. The logic is rather simple once it is grasped, but it takes a new way of looking at the atmosphere — not as a single slab, like the gas in Koch's tube (or the glass over a greenhouse), but as a set of interacting layers. (The full explanation is in the essay on Simple Models, use link at right.) |
|
| The subtle difference was scarcely noticed for many decades. In the tiny group of scientists interested in the physics of climate, hardly anyone thought it was worth speculating about something that might happen in an unimaginably distant future. After Ångström published his conclusions in 1900, the few scientists who had taken an interest in the matter (Chamberlin, for one) concluded that Arrhenius's hypothesis had been proven wrong, and turned to other questions. Arrhenius responded with a long paper, criticizing Koch's measurement in scathing terms. He also developed complicated arguments to explain that absorption of radiation in the upper layers was important, that water vapor was not important in those very dry layers, and anyway the bands of the spectrum where water vapor was absorbed did not entirely overlap the CO2 absorption bands. Other scientists seem not to have noticed or understood the paper. Theoretical work on the question stagnated for decades, and so did measurement of the level of CO2 in the atmosphere.(10*) |
|
| A few scientists dissented from the view that changes of CO2 could have no effect. An American physicist, E.O. Hulburt, pointed out in 1931 that investigators had been mainly interested in pinning down the intricate structure of the absorption bands (which offered fascinating insights into the new theory of quantum mechanics) "and not in getting accurate absorption coefficients." Hulburt's own calculations supported Arrhenius's estimate that doubling or halving CO2 would bring something like a 4°C rise or fall of surface temperature, and thus "the carbon dioxide theory of the ice ages... is a possible theory."(11) Hardly anyone noticed this paper. Hulburt was an obscure worker at the U.S. Naval Research Laboratory, and he published in a journal, the Physical Review, that few meteorologists read. Their consensus was stated in such authoritative works as the American Meteorological Society's 1951 Compendium of Meteorology: the idea that adding CO2 would change the climate "was never widely accepted and was abandoned when it was found that all the long-wave radiation [that would be] absorbed by CO2 is [already] absorbed by water vapor."(11a) | <=Radiation math |
| Even if people had recognized this was untrue, there were other well-known reasons to deny any greenhouse effect in the foreseeable future. These reasons reflected a nearly universal conviction that the Earth automatically regulated itself in a "balance of nature." Getting to specifics, scientists repeated the plausible argument that the oceans would absorb any excess gases that came into the atmosphere. Fifty times more carbon is dissolved in seawater than in the wispy atmosphere. Thus the oceans would determine the equilibrium concentration of CO2, and it would not easily stray from the present numbers. | |
| If somehow the oceans failed to stabilize the system, organic matter was another good candidate for providing what one scientist called "homeostatic regulation."(12) The amount of carbon in the atmosphere is only a small fraction of what is bound up not only in the oceans but also in trees, peat bogs, and so forth. Just as seawater would absorb more gas if the concentration increased, so would plants grow more lushly in air that was "fertilized" with extra carbon dioxide. Rough calculations seemed to confirm the comfortable belief that biological systems would stabilize the atmosphere by absorbing any surplus. One way or another, then, whatever gases humanity added to the atmosphere would be absorbed — if not at once, then within a century or so — and the equilibrium would automatically restore itself. As one respected expert put it baldly in 1948, "The self-regulating mechanisms of the carbon cycle can cope with the present influx of carbon of fossil origin."(13) |
|
| Yet the theory that atmospheric CO2 variations could change the climate was never altogether forgotten. An idea so simple on the face of it, an idea advanced (however briefly) by outstanding figures like Arrhenius and Chamberlin, had to be mentioned in textbooks and review articles if only to refute it. Arrhenius's outmoded hypothesis persisted in a ghostly afterlife. | |
| Callendar’s Advocacy TOP OF PAGE | |
| The greenhouse warming theory found a lone advocate. In 1938 an English engineer, Guy Stewart Callendar, tried to revive the old idea. An expert on steam technology, Callendar apparently took up meteorology as a hobby to fill his spare time.(14) Many people, looking at weather stories from the past, had been saying that a warming trend was underway. When Callendar compiled measurements of temperatures from the 19th century on, he found they were right. He went on to dig up and evaluate old measurements of atmospheric CO2 concentrations. He concluded that over the past hundred years the concentration of the gas had increased by about 10%. This rise, Callendar asserted, could explain the observed warming. For he understood (perhaps from Hulburt's calculation) that even if the CO2 in the atmosphere did already absorb all the heat radiation passing through, adding more of the gas would raise the height in the atmosphere where the crucial absorption took place. That, he calculated, would make for warming. |
|
| As for the future, Callendar estimated, on flimsy grounds, that a doubling of CO2 could gradually bring a 2°C rise in some distant future. Although he understood that industrial emissions were already far greater than in Arrhenius's day, Callendar never imagined the exponential climb that would make a doubling possible as soon as the late 21st century. He did hint that over the centuries the rise might trigger a shift to a self-sustaining warmer climate (which did not strike him as a bad prospect). But future warming was a side issue for Callendar. Like all his predecessors, he was mainly interested in solving the mystery of the ice ages.(15) | <=Simple models =>Revelle's result <=>Biosphere = Milestone |
| Callendar's publications attracted some attention, and climatology textbooks of the 1940s and 1950s routinely included a brief reference to his studies. But most meteorologists gave Callendar's idea scant credence. In the first place, they doubted that CO2 had increased at all in the atmosphere. The old data he had sorted through were untrustworthy, for measurements could vary with every change of wind that brought emissions from some factory or forest. Already in the nineteenth century scientists had observed that the level of the gas rose, for example, near a flock of sheep busy exhaling the gas, and dropped in London during the inactivity of a bank holiday. (As late as 1956, when a graph of CO2 measurements since 1800 was published, nobody seems to have noticed that it showed an obvious upward trend.)(16) If in fact the level was rising, scientists felt that could only be detected by a meticulous program stretching decades into the future.(17*) | |
| The objections that had been raised against Arrhenius also had to be faced. Wouldn't the immense volume of the oceans absorb all the extra CO2? Callendar countered that the thin layer of ocean surface waters would quickly saturate, and it would take thousands of years for the rest of the oceans to turn over and be fully exposed to the air.(18) But nobody knew the actual turnover rate, and it seemed that the oceans would have time to handle any extra gases. According to a well-known estimate published in 1924, even without ocean absorption it would take 500 years for fuel combustion to double the amount of CO2 in the atmosphere.(19) | |
| There was also the old objection, which most scientists continued to find decisive, that the overlapping absorption bands of CO2 and water vapor already blocked all the radiation that those molecules were capable of blocking. Callendar tried to explain that the laboratory spectral measurements were woefully incomplete.(20) Gathering scattered observational data, he argued that there were parts of the spectrum where the CO2 bands did not overlap with water vapor absorption. Some scientists found this convincing, or at least kept an open mind on the question. But it remained the standard view that, as an official U.S. Weather Bureau publication put it, the masking of CO2 absorption by water vapor was a "fatal blow" to the CO2 theory. Therefore, said this authority, "no probable increase in atmospheric CO2 could materially affect" the balance of radiation.(21) | |
| Most damaging of all, Callendar's calculations of the greenhouse effect temperature rise, like Arrhenius's, ignored much of the real world's physics. For example, as one critic pointed out immediately, he only calculated how heat would be shuttled through the atmosphere by radiation, ignoring the crucial energy transport by convection as heated air rose from the surface (this deficiency would haunt greenhouse calculations through the next quarter-century). Worse, any rise in temperature would allow the air to hold more moisture, which would probably mean more clouds that would reflect sunlight and thus preserve the natural balance. Callendar admitted that the actual climate change would depend on interactions involving changes of cloud cover and other processes that no scientist of the time could reliably calculate. | |
| Few thought it worthwhile to speculate about such dubious questions, where data were rudimentary and theory was no more than hand-waving. Better to rest with the widespread conviction that the atmosphere was a stable, automatically self-regulated system. The notion that humanity could permanently change global climate was implausible on the face of it, hardly worth a scientist's attention.(22) | |
| The scientists who brushed aside Callendar's claims were reasoning well enough. (Subsequent work has shown that the temperature rise up to 1940 was, as his critics thought, mainly caused by some kind of natural cyclical effect, not by the still relatively low CO2 emissions. And the physics of radiation and climate was indeed too poorly known at that time to show whether adding more gas could make much difference.) Yet if Callendar was mistaken when he insisted he could prove global warming had arrived, it was a fortunate mistake. | |
| Research by definition is done at the frontier of ignorance. Like nearly everyone described in these essays, Callendar had to use intuition as well as logic to draw any conclusions at all from the murky data and theories at his disposal. Like nearly everyone, he argued for conclusions that mingled the true with the false, leaving it to later workers to peel away the bad parts. While he could not prove that greenhouse effect warming was underway, he had given sound reasons to reconsider the question. We owe much to Callendar's courage. His claims rescued the idea of global warming from obscurity and thrust it into the marketplace of scientific ideas. Not everyone dismissed his claims. Their very uncertainty attracted scientific curiosity. |
|
| The Theory Restored (1950-1958) TOP OF PAGE | |
| The complacent view that CO2 from human activity could never become a problem was overturned during the 1950s by a series of costly observations. This was a consequence of the Second World War and the Cold War, which brought a new urgency to many fields of research. American scientists enjoyed massively increased government funding, notably from military agencies. The officials were not aiming to answer academic questions about future climates, but to provide for pressing military needs. Almost anything that happened in the atmosphere and oceans could be important for national security. Among the first products of these research efforts were new data for the absorption of infrared radiation, a topic of more interest to weapons engineers than meteorologists.(23) |
|
| The early experiments that sent radiation through gases in a tube, measuring bands of the spectrum at sea-level pressure and temperature, had been misleading. The bands seen at sea level were actually made up of overlapping spectral lines, which in the primitive early instruments had been smeared out into broad bands. Improved physics theory and precise laboratory measurements in the 1940s and after encouraged a new way of looking at the absorption. Scientists were especially struck to find that at low pressure and temperature, each band resolved into a cluster of sharply defined lines, like a picket fence, with gaps between the lines where radiation would get through.(24) As Hulburt and Callendar had claimed, the most important CO2 absorption lines did not lie exactly on top of water vapor lines. Instead of two overlapping bands, there were two sets of narrow lines with spaces for radiation to slip through. So even if water vapor in the lower layers of the atmosphere did entirely block any radiation that could have been absorbed by CO2, that would not keep the gas from making a difference in the rarefied and frigid upper layers. Those layers held very little water vapor anyway. And scientists were coming to see that you couldn't just calculate absorption for radiation passing through the atmosphere as a whole, you had to understand what happened in each layer — which was far harder to calculate. |
|
| Digital computers were now at hand for such calculations. The theoretical physicist Lewis D. Kaplan decided it was worth taking some time away from what seemed like more important matters to grind through extensive numerical computations. In 1952, he showed that in the upper atmosphere, adding more CO2 must change the balance of radiation.(25) |
|
| But would adding carbon dioxide in the upper layers of the air significantly change the surface temperature? Only detailed computations, point by point across the infrared spectrum and layer by layer down through the atmosphere, could answer that question. By 1956, such computations could be carried out thanks to the increasing power of digital computers. The physicist Gilbert N. Plass took up the challenge of calculating the transmission of radiation through the atmosphere (he too did it out of sheer curiosity, as a diversion from his regular work making calculations for weapon engineers). He nailed down the likelihood that adding more CO2 would increase the interference with infrared radiation. Going beyond this qualitative result, Plass calculated that doubling the level would bring a 3-4°C rise. Assuming that emissions would continue at the current (1950s) rate, he expected that human activity would raise the average global temperature "at the rate of 1.1 degree C per century."(26) |
|
| The computation, like Callendar's, paid no attention to possible changes in water vapor and clouds, and overall was too crude to convince scientists. "It is almost certain," one authority scolded, "that these figures will be subject to many strong revisions."(27) Yet Plass had proved one central point: it was a mistake to dismiss the greenhouse effect with spectroscopic arguments. He warned that climate change could be "a serious problem to future generations" — although not for several centuries. Following the usual pattern, Plass was mainly interested in the way variations in CO2 might solve the mystery of the ice ages. "If at the end of this century the average temperature has continued to rise," he wrote, then it would be "firmly established" that CO2 could cause climate change. People who read science notes in the back pages of the New York Times would find a leading physicist confirming that "it may take thirty or forty years to find out" how CO2 would affect the planet’s energy balance. Over the next decades quite a few other scientists would predict — correctly — that global warming would become obvious around the start of the 21st century.(28) |
|
| None of this work met the argument that the oceans would promptly absorb nearly all the CO2 humanity might emit. Plass had estimated that gas added to the atmosphere would stay there for a thousand years. Equally plausible estimates suggested that the surface waters of the oceans would absorb it in a matter of days.(29) Fortunately, scientists could now track the movements of carbon with a new tool: the radioactive isotope carbon-14. | |
| This radioactive isotope was produced abundantly in the fallout from nuclear weapon tests during the 1950s. Sensitive instruments could detect even a tiny amount carried thousands of miles on the world’s winds, and the data provided the first comprehensive mapping of the global circulation of air. The results confirmed what had only been guessed: within a few years any addition of CO2 was well mixed throughout the atmosphere, from pole to pole and from the surface into the highest stratosphere.(29a) | |
| Carbon-14 is also created by cosmic rays in the upper atmosphere and then decays over millennia. The carbon in ancient coal and oil is so old that it entirely lacks the radioactive isotope. Therefore emissions from burning fossil fuels would add only plain carbon to the atmosphere. In 1955, the chemist Hans Suess reported an analysis of wood from trees grown over the past century, finding that the newer the wood, the higher its ratio of plain carbon to carbon-14. He had detected an increase of fossil carbon in the atmosphere. | |
| The amount of fossil carbon that Suess saw added to the atmosphere was barely one percent, a fraction so low that he concluded that the oceans were indeed taking up most of the carbon that came from burning fossil fuels. A decade would pass before he reported more accurate studies, which showed a far higher fraction of fossil carbon. Yet already in 1955 it was evident that Suess's data were preliminary and insecure. The important thing he had demonstrated was that fossil carbon really was showing up in the atmosphere. More work on carbon-14 should tell just how carbon was circulating in the planetary system.(30) |
|
| Suess took up the problem in collaboration with Roger Revelle at the Scripps Institution of Oceanography in La Jolla, California. (Some other carbon-14 experts attacked the topic independently, all reaching much the same conclusions.) From measurements of how much of the isotope was found in the air and how much in seawater, they calculated the movements of CO2. They found that the ocean surface waters took up a typical molecule of CO2 from the atmosphere within a decade or so. Measurements of the travels of radioactive carbon from bomb tests meanwhile showed that the oceans turned over in several hundred years (an estimate soon confirmed by evidence from other studies).(31) At first sight that seemed fast enough to sweep any extra CO2 into the depths. |
|
| But Revelle had been studying the chemistry of the oceans through his entire career, and he knew that the seas are not just salt water but a complex stew of chemicals. These chemicals create a peculiar buffering mechanism that stabilizes the acidity of seawater. The mechanism had been known for decades, but Revelle now realized that it would prevent the surface layer of seawater from retaining all the extra CO2 molecules it took up. The key fact was that adding CO2 to the water raised its acidity. That pushed some of the molecules back into the air. A careful look showed that the surface layer could not really absorb much additional gas — barely one-tenth the amount a naïve calculation would have predicted. |
|
| A supplementary essay on Revelle's Discovery tells this crucial story in full, as a detailed example of the complex interactions often found in geophysical research. | |
| Revelle did not at first recognize the full significance of his work. He made a calculation in which he assumed that industry would emit CO2 at a constant rate (like most people at the time, he scarcely grasped how explosively population and industry were rising). This gave a prediction that the concentration in the air would level off after a few centuries, with an increase of no more than 40%. Revelle did note that greenhouse effect warming "may become significant during future decades if industrial fuel combustion continues to rise exponentially." He also wrote that "Human beings are now carrying out a large scale geophysical experiment of a kind that could not have happened in the past nor be reproduced in the future."(32) |
|
| As sometimes happens with landmark scientific papers, written in haste while understanding just begins to dawn, Revelle's explanation was hard to grasp. Other scientists failed to see the point that was obscurely buried in the calculations, and continued to deny there was a greenhouse effect problem. In 1958, when Callendar published a paper to insist once again that CO2 observations showed a steady rise from the 19th century, he noted Revelle's paper but still confessed that he did not understand why "the oceans have not been accepting additional CO2 on anything like the accepted scale."(33) Finally in 1959 two meteorologists in Sweden, Bert Bolin and Erik Eriksson, caught on. They explained the seawater buffering clearly — so clearly that during the next few years, some scientists cited Bolin and Eriksson's paper for this decisive insight rather than Revelle and Suess's (only in later years was Revelle always cited for the discovery). | |
| The central insight was that although seawater did rapidly absorb CO2, most of the added gas would promptly evaporate back into the air before the slow oceanic circulation swept it into the abyss. To be sure, the chemistry of air and seawater would eventually reach an equilibrium — but that would take thousands of years. Arrhenius had not concerned himself with timescales shorter than that, but in the 1950s some geoscientists were beginning to pay attention to faster changes. Bolin and Eriksson predicted (correctly, as it turned out) that atmospheric CO2 would rise exponentially. A historian later remarked that their graph, with its steeply climbing curve, "set alarm bells ringing" in the little community of geoscientists who noticed it.(34) | |
| Keeling's Curve TOP OF PAGE | |
| In the late 1950s a few American scientists, starting with Plass, tentatively began to inform the public that greenhouse gases might become a problem within the foreseeable future. Revelle in particular warned journalists and government officials that greenhouse warming deserved serious attention. The stakes were revealed when Bolin and Eriksson pursued the consequences of their calculation to the end. They assumed industrial production would climb exponentially, and figured that atmospheric CO2 would rise some 25% by the year 2000. That was a far swifter rise than anyone before had suggested. As the New York Times reported in a brief note, Bolin suggested that the effect on climate "might be radical."(34a) In 1962, a still stronger (although also little heeded) warning was sounded by the Russian climate expert Mikhail Budyko. His calculations of the exponential growth of industrial civilization suggested a drastic global warming within the next century or so. |
|
| Both Plass and Revelle remarked that if their ideas were correct, the warming should visibly emerge above the natural "noise" of weather around the beginning of the next century. Over the next few decades other climate scientists would make the same prediction. (They were right: it would be precisely in 2001 that the world's climate scientists announced that global warming had been unequivocally detected.)(35) | |
| Once meteorologists understood that ocean uptake was slow, they found it possible that CO2 levels had been rising, just as Callendar insisted. Yet it was only a possibility, for the measurements were all dubious. By the mid 1950s, researchers were saying that it was important to measure, much more accurately, the concentration of CO2 in the atmosphere.(36) A Scandinavian group accordingly set up a network of 15 measuring stations in their countries. Their only finding, however, was a high noise level. Their measurements apparently fluctuated from day to day as different air masses passed through, with differences between stations as high as a factor of two. Only much later was it recognized that their methods of analyzing the air had been inadequate, and responsible for much of the noise.(37) A leading authority summarized the scientific opinion of the late 1950s: "it seems almost hopeless to arrive at reliable estimates [of CO2]... by such measurements in limited areas." To find if the gas level was changing, measurements would have to "be made concurrently and during a great number of years" at many locations.(38) | |
| Charles David (Dave) Keeling held a different view. As he pursued local measurements of the gas in California, he saw that it might be possible to hunt down and remove the sources of noise. Technical advances in infrared instrumentation allowed an order of magnitude improvement over previous techniques for measuring gases like CO2. Taking advantage of that, however, would require many costly and exceedingly meticulous measurements, carried out someplace far from disturbances. Most scientists, looking at the large and apparently unavoidable fluctuations in the raw data, thought such precision irrelevant and the instrumentation too expensive. But Revelle and Suess happened to have enough funds to hire Keeling to measure CO2 with precision. |
|
| A supplementary essay tells the precarious story of Keeling's funding and monitoring of CO2 levels as a detailed example of how essential research and measurements might be fed — or starved. | |
| Revelle's simple aim was to establish a baseline "snapshot" of CO2 values around the world, averaging over the large variations he expected to see from place to place and from time to time. After a couple of decades, somebody could come back, take another snapshot, and see if the average CO2 concentration had risen. Keeling did much better than that with his new instruments. With painstaking series of measurements in the pristine air of Antarctica and high atop the Mauna Loa volcano in Hawaii, he nailed down precisely a stable baseline level of CO2 in the atmosphere. In 1960, with only two full years of Antarctic data in hand, Keeling reported that this baseline level had risen. The rate of the rise was approximately what would be expected if the oceans were not swallowing up most industrial emissions.(39*) |
|
| Lack of
funds soon closed down the Antarctic station, but Keeling managed
to keep the Mauna Loa measurements going with only a short hiatus.
As the CO2 record extended it became increasingly
impressive, each year noticeably higher. Soon Keeling's curve, jagged
but inexorably rising, was widely cited by scientific review panels
and science journalists.(40)
For both scientists and the public it became the primary icon of the
greenhouse effect.
(Keeling understood immediately that the curve is jagged because plants in the Northern Hemisphere take up CO2 as they grow in Spring and Summer, and release it as they decay in Autumn and Winter.) Carbon Dioxide: Key to Climate
Change?
(1960s-1970s) |
<=Keeling's funds |
| New carbon-14 measurements were giving scientists solid data to chew on. Researchers began to work out just how carbon moves through its many forms in the air, ocean, minerals, soils, and living creatures. They plugged their data into simple models, with boxes representing each reservoir of carbon (ocean surface waters, plants, etc.), and arrows showing the exchanges of CO2 among the reservoirs. The final goal of most researchers was to figure out how much of the CO2 produced from fossil fuels was sinking into the oceans, or perhaps was being absorbed by vegetation (see above). But along the way there were many curious puzzles, which forced researchers to make inquiries among experts in far distant fields. | <=Biosphere |
| During the 1960s, these tentative contacts among almost entirely separate research communities developed into ongoing interchanges. Scientists who studied biological cycles of elements such as nitrogen and carbon (typically supported by forestry and agriculture interests) got in touch with, among others, geochemists (typically in academic retreats like the Scripps Institution of Oceanography in La Jolla, California). This emerging carbon-cycle community began to talk with atmospheric scientists who pursued interests in weather prediction (typically at government-funded laboratories like the National Center for Atmospheric Research in Boulder, Colorado, or the Geophysical Fluid Dynamics Laboratory in Princeton, New Jersey). One valuable example of this crossover of interests was a calculation published by Princeton computer specialists in 1967. They had managed to produce a model that simulated something roughly like the actual climate of the planet, with deserts and sea ice and trade winds in all the right places. Out of curiosity they doubled the amount of CO2 in their simulated atmosphere. The simulated global temperature rose a couple of degrees.(41) |
|
| Even before that, in 1965, a prestigious group of scientists had suggested with noteworthy foresight that "By the year 2000 the increase in atmospheric CO2 ... may be sufficient to produce measurable and perhaps marked changes in climate." But most scientists at this time were scarcely concerned about CO2 as an agent of future global warming. They addressed the gas as simply one component in their study of biological, oceanographic or meteorological systems.(42) Most stuck with the old assumption that the Earth's geochemistry was dominated by stable mineral processes, operating on a planetary scale over millions of years. People did not easily grasp how sensitive the Earth's atmosphere was to biological forces — the totality of the planet's living activity — to say nothing of the fraction of that activity affected by humanity. |
|
| Leading scientists continued to doubt that anyone needed to worry at all about the greenhouse effect. The veteran climate expert Helmut Landsberg stressed in a 1970 review that little was known about how humans might change the climate. At worst, he thought, the rise of CO2 at the current rate might bring a 2°C temperature rise over the next 400 years, which "can hardly be called cataclysmic."(43) Meanwhile Hubert H. Lamb, the outstanding compiler of old climate data, wrote that the effects of CO2 were "doubtful... there are many uncertainties." The CO2 theory, he pointed out, failed to account for the numerous large shifts that he had uncovered in records of climate from medieval times to the present. Many agreed with Lamb that a "rather sharp decline" of Northern Hemisphere temperature that had been observed since the 1940s put the whole matter in question. They argued that other rapidly increasing types of human pollution, particles like sulfates and factory smoke, were reflecting sunlight and would bring cooling rather than warming. Others nevertheless continued to concentrate on greenhouse warming. For example, in 1972 J.S. Sawyer correctly predicted, in the leading journal Nature, an 0.6°C rise by 2000. He saw "no immediate cause for alarm" but "certainly need for further study." After all, Sawyer warned, "human activities are approaching a scale at which they cannot be completely ignored as possible contributors to climate and climatic change." (44) |
|
| At this time research on changes in the atmosphere's CO2 had been, almost by definition, identical to research on the greenhouse effect. But in the late 1970s and early 1980s, calculations found that methane and other gases emitted by human activities could have a greenhouse effect that was sometimes molecule for molecule tens or hundreds of times greater than CO2. Nevertheless, most of the scientific interest continued to revolve around CO2. |
|
| Up to this point, I have described the central core of research
on the effects of CO2 on climate — research
that before the 1970s scarcely interacted with other subjects. During
the 1970s, the greenhouse effect became a major topic in many overlapping
fields. Scientists eventually determined that a bit over half of the
effect of humans on climate change is due to emissions of
CO2 (mainly from fossil fuels but also from
deforestation and cement manufacture). The rest of the effect is due
to methane and other gases emitted by human activities; atmospheric pollution by smoke and dust; and changes
in land use such as replacing dark forest with sunlight-reflecting
crops or desert. These factors are discussed in other topical essays
(especially those on Other Greenhouse Gases,
Aerosols, and The Biosphere.)
The remainder of this essay covers only the developments most directly
related to the gas CO2 itself. |
|
| Carbon cycle studies proliferated. A major stimulus was a controversy that erupted in the early 1970s and stubbornly resisted resolution. National economic statistics yielded reliable figures for how much CO2 humanity put into the air each year from burning fossil fuels. The measurements of the annual increase by Keeling and others showed that less than half of the new carbon could be found in the atmosphere. Where was the rest? Oceanographers calculated how much of the gas the oceans took up, while other scientists calculated how much the biosphere took up or emitted. The numbers didn't add up — some of the carbon was "missing." Plainly, scientists did not understand important parts of the carbon cycle. Looking at large-scale climate changes, such as between ice ages and warm periods, they turned up a variety of possible interactions with climate involving plant life and ocean chemistry. The papers addressing these topics became increasingly complex. |
|
| Some scientists took up the old argument that fertilization of plant life by additional CO2, together with uptake by the oceans, would keep the level of gas from rising too sharply. Keeling, however, warned that by the middle of the next century, plants could well reach their limit in taking up carbon (as every gardener knows, beyond some point more fertilizer is useless or even harmful). Further, there would eventually be so much CO2 in the ocean surface waters that the oceans would not be able to absorb additional gas as rapidly as at present.(45) Keeling kept refining and improving his measurements of the CO2 level in the atmosphere to extract more information. The curve did not climb smoothly, but stuttered through a seasonal cycle, plus mysterious spells of faster and slower growth. But over a long term, say a decade, the rise was clearly as inexorable as the tides.(46) Meanwhile, computer models were coming into better agreement on the future warming to be expected from increased CO2. And global temperatures began to rise again. It was getting increasingly difficult for scientists to believe that the greenhouse effect was no cause for worry. |
|
| Meanwhile global temperatures resumed their rise. The cooling from smoke particles had a limit, for the particles dropped from the atmosphere in weeks whereas the accumulating CO2 would linger for centuries. It was getting increasingly difficult for scientists to claim that the greenhouse effect was no cause for worry. By 1979 the ever more powerful computers had confirmed that it was impossible to construct a model that could mimic the current climate and that did not warm up a few degrees if the level of the gas was doubled. |
<=Aerosols |
How would we know if we should take action to avert dangerous climate
change? In 1981 a couple of experienced climate scientists reviewed
the predictions of the best computer models, and compared them with
the natural fluctuations of climate observed in the past.(46a)
Their conclusion: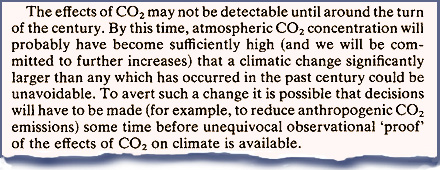
|
|
| Evidence from the Ice TOP OF PAGE | |
| Concerns were sharpened by new evidence from holes arduously drilled into the Greenland and Antarctic ice caps. The long cylinders of ice extracted by the drills contained tiny bubbles with samples of ancient air — by good fortune there was this one thing on the planet that preserved CO2 intact. Group after group cut samples from cores of ice in hopes of measuring the level. For two decades, every attempt failed to give consistent and plausible results. Finally reliable methods were developed. The trick was to clean an ice sample scrupulously, crush it in a vacuum, and quickly measure what came out. In 1980, a team published findings that were definite, unexpected, and momentous. |
|
| In the depths of the last ice age, the level of CO2 in the atmosphere had been as much as 50% lower than in our own warmer times. (These Greenland measurements were later called into question, but the dramatically lower ice-age level was quickly confirmed by other studies.)(47) Pushing forward, by 1985 a French-Soviet drilling team at Vostok Station in central Antarctica had produced an ice core two kilometers long that carried a 150,000-year record, a complete ice age cycle of warmth, cold and warmth. They found that as the great ice caps grew and melted, the level of atmospheric CO2 had fallen and risen in remarkably close step with temperature, (Temperature at the time the ice formed could be read from isotopes in the same chunk of ice, another brilliant technical feat worked out in earlier decades.) | |
| Most telling of all was the numerical relationship — doubling the CO2 level had meant a rise of around 3°C. That was exactly the same as the consensus of computer models. When scientists get the same numbers using utterly different methods, they begin to feel that they have touched reality.(48*) | |
| The Vostok core, an ice driller declared, "turned the tide in the greenhouse gas controversy."(49) At the least it nailed down what one expert called an "emerging consensus that CO2 is an important component in the system of climatic feedbacks." More generally, he added, it showed that further progress would "require treating climate and the carbon cycle as parts of the same global system rather than as separate entities."(50) The rise and fall of temperature was tied up in a complex way with interlocking global cycles involving not just the mineral geochemistry of CO2 in air and seawater, but also methane emissions, the growth and decay of forests and bogs, changes of the plankton population in the oceans, and still more features of the planet's biosphere. |
<=>Biosphere |
| All through these decades, a few geologists had continued to pursue the original puzzle raised by Tyndall and Chamberlin — had changes of CO2 been responsible for the greatest of climate changes? These were the vast slow swings, lasting tens of millions of years, between eras like the age of dinosaurs with summer-like climates almost from pole to pole, and eras like our own when continental ice caps waxed and waned. There was no consensus about the causes of these grand shifts, and nobody had found a way to reliably measure the atmosphere many millions of years back. Nevertheless, by the 1980s, scientists turned up evidence suggesting that CO2 levels had been elevated during the great warm eras of the past. | |
| Lines of thinking converged to emphasize the importance of the greenhouse effect. Geologists had been puzzled for decades by a calculation that astrophysicists insisted was indisputable: billions of years ago the Sun had been dimmer, and had gradually grown brighter as it consumed its nuclear fuel. In the distant past the oceans should have been frozen entirely. Yet somehow the Earth's temperature had remained neither too cold nor too hot to sustain life. The best guess was that CO2 acted as a thermostat for the planet. Volcanoes presumably put the gas into the atmosphere at a fairly constant rate. In the earliest times there could have been enough greenhouse gases to keep the planet unfrozen. But chemical processes run faster at higher temperatures, so as the Sun grew brighter the weathering of rocks would take up CO2 faster. As the rocks eroded, rivers carried the soil into the seas, where the carbon eventually wound up in compounds deposited on the seabed. Thus a rough self-sustaining balance would be maintained among the forces of solar radiation, volcanic emissions, greenhouse warming, weathering, and ocean uptake. To be sure, if there was some great disturbance the system might take millions of years to stabilize.(51) | |
| Such great disturbances — even a totally glaciated "snowball Earth" — were not a fantasy of oversimplified models. Geologists turned up evidence that more than half a billion years ago the oceans had actually frozen over, if not entirely then mostly. That seemed impossible, for how could the Earth have escaped the trap and warmed up again? There was at least one obvious way (but it was only obvious once someone thought of it, which took some years). Over many thousands of years, volcanoes would have continued to inject CO2 into the atmosphere. There the gas would have accumulated, since it could not get into the frozen seas. Eventually a colossal greenhouse effect might have melted the ice.(52*) |
|
| The planet Venus, on the other hand, seemed to have suffered a runaway greenhouse catastrophe: a surface that might once have been only a little warmer than the Earth's had heated up enough to evaporate the carbon in the rocks into the atmosphere while ever more CO2 was created, making the planet a hellish furnace. All this was speculative, and proved little about our future climate. But it added to the gathering conviction that CO2 was the very keystone of the planet's climate system — a system by no means as cozily stable as it appeared. |
|
| Another unusual disturbance had begun. The proof was in the Vostok team’s 1987 report of their analysis of ice cores reaching back through the entire previous glacial period and into the warm time before. (And the drill was still only partway down; by the time they stopped drilling a dozen years later, the team had recovered ice going back 400,000 years, through four complete glacial cycles.) The CO2 levels in their record got as low as 180 parts per million in the cold periods and reached 280 in the warm periods, never higher. But in the air above the ice, the level of the gas had reached 350 — far above anything seen in this geological era and still climbing.(53) |
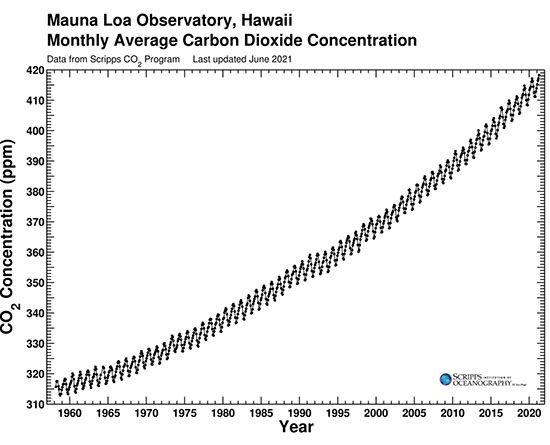 Level of CO2 in the atmosphere, 1958-2021 The curve has been climbing exponentially, much faster now than in the 1960s. Despite some attempts to slow down emissions, the quantity of gas added to the atmosphere is doubling every 30-35 years. See latest results from Scripps COhttps://scrippsco2.ucsd.edu/graphics_gallery/2 program. |
| Feedbacks (1990s) TOP OF PAGE | |
| During the 1990s, another ice core measurement indicated that at the end of the last glacial period, the initial rise of temperature in Antarctica had preceded CO2 changes by several centuries. However, the ice core described only a single location, deeply influenced by changes in ocean currents. A wider variety of measurements found global temperature lagging behind the rise of CO2. Scientists debated whether the dates could be measured so precisely, and in the end were satisfied to say that whichever came first, the two were tightly correlated.(53a*) The discussion confused many people. If changes in CO2 might have begun after changes in temperature, didn’t that contradict the greenhouse theory of global warming? But in fact the discrepancy was not good news. |
|
| It seemed that rises or falls in carbon dioxide levels had not initiated the glacial cycles. In fact most scientists had long since abandoned that hypothesis. In the 1960s, painstaking studies had shown that subtle shifts in our planet's orbit around the Sun (called "Milankovitch cycles") matched the timing of ice ages with startling precision. The amount of sunlight that fell in a given latitude and season varied predictably over millennia. As some had pointed out ever since the 19th century, in times when sunlight fell more strongly on northern latitudes in the spring, snow and sea ice would not linger so long; the dark earth and seawater would absorb more sunlight, and get warmer. However, calculations showed that this subtle effect should cause no more than a small regional warming. How could almost imperceptible changes in the angle of sunlight cause entire continental ice sheets to build up and melt away? |
The full history
is in the essay on |
| The new ice cores suggested that a powerful feedback amplified the changes in sunlight. The crucial fact was that a slight warming would cause the level of greenhouse gases to rise slightly. For one thing, warmer oceans would evaporate out more gas. For another, as the vast Arctic tundras warmed up, the bogs would emit more CO2 (and another greenhouse gas, methane, also measured in the ice with a lag behind temperature). The greenhouse effect of these gases would raise the temperature a little more, which would cause more emission of gases, which would... and so forth, hauling the planet step by step into a warm period. Many thousands of years later, the process would reverse when the sunlight falling in key latitudes weakened. Bogs and oceans would absorb greenhouse gases, ice would build up, and the planet would slide back into an ice age. This finally explained how tiny shifts in the Earth's orbit could set the timing of the enormous swings of glacial cycles. |
|
| Or, more ominously, how a change in the gas level initiated by humanity might be amplified through a temperature feedback loop. The ancient ice ages were the reverse of our current situation, where humanity was initiating the change by adding greenhouse gases. As the gas level rose, temperature would rise with a time lag — although only a few decades, not centuries, for the rates of change were now enormously faster than the orbital shifts that brought ice ages. |
|
| There were many ways temperature or other climate features could influence the carbon dioxide level one way or another. Perhaps variations of temperature and of weather patterns caused land vegetation to release extra CO2, or take it up... perhaps the oceans were involved through massive changes in their circulation or ice cover... or through changes in their CO2-absorbing plankton, which would bloom or decline insofar as they were fertilized by minerals, which reached them from dusty winds, rivers, and ocean upwelling, all of which could change with the climate... or perhaps there were still more complicated and obscure effects. Into the 21st century, scientists kept finding new ways that warming would push more of the gas into the atmosphere. As one of them remarked, "it is difficult to explain the demise of the ice sheets without the added heating from CO2 ... this gas has killed ice sheets in the past and may do so again."(54) |
|
| A key point stood out. The cycling of carbon through living systems was not something to trifle with. In the network of feedbacks that made up the climate system, CO2 was a main driving force. This did not prove by itself that the greenhouse effect was responsible for the warming seen in the 20th century. And it did not say how much warming the rise of CO2 might bring in the future. What was now beyond doubt was that the greenhouse effect had to be taken very seriously indeed.(55) | =>Climate cycles |
| The Computer Models Vindicated (1990s-2000s)
TOP OF PAGE |
|
| By now there were a dozen teams around the world using computers to integrate every advance in observation or theory. As the 21st century arrived, the growing agreement among the rival teams, and the consistency of their models' results with many different kinds of observations, became overwhelmingly convincing. No model that could simulate the Earth's climate — and some of the simulations had become very good indeed — failed to show warming if its greenhouse gas level was raised. Scarcely any expert with a record of contributing to climate science now doubted that CO2 and other greenhouse gases were at least partly responsible for the unprecedented warming all around the world since the 1970s. | |
| A final nail in the coffin of scientific skepticism came in 2005, when a team compiled accurate long-term measurements of temperatures in all the world's ocean basins. It was not in the air but the massive oceans, after all, that most of any heat added would soon wind up. Indeed natural fluctuations had kept air temperatures roughly the same since the late 1990s; the significant question was whether the oceans were continuing to warm. The team found that over many decades the planet's content of heat-energy had been rising, and was rising still (this continued steadily after 2005 as well). There was only one remotely plausible source of the colossal addition of energy: the Earth must be taking in more energy from sunlight than it was radiating back into space. Simple physics calculated that to heat all that seawater required nearly an extra watt per square meter, averaged over the planet's entire surface, year after year. The number was just what the elaborate greenhouse effect computations had been predicting for decades. James Hansen, leader of one of the studies, called the visible increase of the planet's heat content a "smoking gun" proof of greenhouse effect warming (see graph below). Moreover, in each separate ocean basin there was a close match between the pattern of rising temperatures measured at each location and depth and detailed model calculations of where the greenhouse effect warming should appear. Warming from other sources, for example a change in the Sun's output, could not produce these patterns. Evidently the modelers were on the right track.(56) |
For the history of all measurements see the essay on the modern temperature trend.
|
| Yet amid all the uncertainties about how carbon cycles operated, how much could we trust the computer models to work under circumstances different from the present? Scientists are more likely to believe something if they can confirm it with entirely independent lines of evidence, preferably from somewhere nobody had looked before. Just such new evidence came up in the 1990s, thanks to an unexpected alliance of paleontology and plant physiology. Studies of plant species that had changed little since the rise of the dinosaurs (magnolia for one) showed that if you exposed them to a higher level of CO2, the structure of tiny pores on their leaves changed. Ancient fossil leaves showed the same changes. | |
| Other kinds of chemical studies of ancient rocks and soils gradually pinned down how the level of the gas had swung widely over geological ages, and the temperature too. In the early 2000s a particularly imaginative technique came to the fore, relying on how the heavy isotopes of carbon and oxygen clump together in minerals to a degree that depends only on temperature. The technique was "technically challenging," as a pioneer remarked with classic understatement, but once it was mastered it beautifully confirmed and extended the other methods. | |
| This sustained effort by many geochemists and their allies managed to get numbers for the "climate sensitivity" in past eras, that is, the response of temperature to a rise in the CO2 level. Not only during the recent ice ages but back over hundreds of millions of years under radically different conditions, a doubled level of the gas had always gone along with a temperature rise of three degrees, give or take a degree, in full agreement with the computer calculations. The modelers had not missed anything essential — greenhouse warming was undoubtedly a basic feature of the planet’s behavior. |
|
| It was reassuring that there seemed scant possibility of a Venus-style runaway greenhouse apocalypse. It was less reassuring to see what the climate had looked like in the ancient eras when CO2 had stood at a high level — a level that humanity would eventually reach if we went on burning all available oil and coal. The Earth had been virtually a different planet, with tropical forests near the poles and sea levels a hundred meters higher. To be sure, it would take many thousands of years to melt entire polar ice caps. But in the meantime even a modest sea-level rise would disrupt humanity's teeming coastal populations. If humanity's emissions continued they seemed bound to bring not only "a warming unprecedented in the past million years," as one of many worried scientists explained, but changes "much faster than previously experienced by natural ecosystems..."(57) | |
| By 2010, new studies had pinned down some truly disturbing numbers about eras in the distant past when CO2 levels had been high — although no higher than we would reach by the late 21st century if emissions continued to rise without restriction. In those eras global temperatures had been at least three degrees higher than at present, and perhaps as much as six degrees higher, that is, in the upper range of what computer models found plausible, if not higher still. For the real planet, a rise in temperature had evidently not been limited by increased cloud reflection or the like. The rise had instead apparently been amplified by positive feedback loops. Ice and oceans and vegetation responded over centuries to the changing conditions with darker surfaces that absorbed sunlight, and additional gas emissions. The computer models did not take these slow feedbacks into account. Hansen and others argued that humanity risked setting off a chain reaction that would eventually bring an altogether catastrophic planetary change.(57a) |
=>Impacts |
| In the first decade of the 21st century, international panels of experts reviewed the evidence and announced conclusions that were checked and endorsed by virtually all the major national science academies, scientific societies, government science agencies and other bodies representative of scientific expertise. All of these bodies declared that the world faced a serious problem, and recommended that governments adopt strict policies to restrict greenhouse gas emissions. (All, that is, except a few self-appointed panels composed primarily of people with limited expertise in climate science, representing ideological and business interests that opposed all forms of government regulation.) Individual climate scientists, were almost unanimously in agreement with the consensus in its broad outlines. To be precise, around the start of the century only 3% of published climate papers gave arguments against the consensus, and by 2020 the number had shrunk to zero. Of course experts continued to argue vehemently over details, as always in frontier research. Critics pounced on every apparent discrepancy. They published long lists of scientists who denied there was any problem — although the lists included hardly any scientist who had made significant contributions to climate research.(58*) Debate over policies to restrict emissions grew increasingly intense. |
The history of these matters is described in essays on international cooperation and public attitudes. |
| Prospects for the 21st Century TOP OF PAGE | |
| Through all these discoveries and controversies, Keeling and his colleagues had kept on quietly monitoring and analyzing the ongoing changes in atmospheric CO2 levels. Since the 1980s, a cooperative international program had been measuring the gas at land stations around the world and along shipping lanes. The baseline continued to rise ominously, with variations that depended on each year's weather. There had been years when the world's atmosphere had gained one billion metric tonnes of the gas, while in other years it gained as much as six billion. But there was only one kink in the rising "Keeling curve" large enough to be visible to the naked eye — a slight slowing in the early 1990s, reflecting the fall of the Soviet Union and the collapse of the economies of Eastern Europe. Otherwise the rise accelerated, not retarded even by the Covid-19 pandemic of 2020-22. | |
| How much did changes in the world's industries and agricultural practices affect the rate of the rise? Economic statistics allowed a good reckoning of how much gas humanity emitted in burning fossil fuels (and in the manufacture of cement, also significant), but the effects of deforestation and other land use changes were not so easy to figure. How much did changes in the level of CO2 reflect changes in the growth or decay of plants, perhaps related to climate fluctuations? What could one learn from the way the curve reacted to temporary climate changes brought on by volcanic eruptions, by the El Niño events that temporarily pumped heat in or out of the Pacific Ocean, and so forth?(59) Further clues came from world-wide measurements of other biologically active gases, especially oxygen. (The exacting techniques for measuring the tiny variations were pioneered by Keeling's son, Ralph Keeling. Along with the seasonal effects that measured the biological carbon cycle, he found a tiny but steady decline of oxygen in the atmosphere. This was exactly as expected from the burning of fossil fuels, confirming that fossil fuels were the main source of the rise in CO2.) Most of the "missing" carbon was finally located, with gradually increasing precision, in rapidly changing forests and forest soils, along with other biological reservoirs.(59a) |
<=>Biosphere |
| Another marker of biological activity was the rare isotope carbon-13. Plants take less of it from the atmosphere than the lighter isotope carbon-12, so the latter is over-represented in coal and oil. The fraction of the lighter isotope in the air was increasing, proving (to a lingering band of skeptics) that the rise in CO2 came from humanity's use of fossil fuel, not from a mineral source such as volcanoes.(60) |
|
| The 21st century brought a grand expansion of studies of the way CO2 was accumulating in the atmosphere, and where the carbon went in the land and oceans. Here as elsewhere in climate research, the global scope and complexity of the problem called forth massive international projects. At thousands of locations instruments measured air, soils, trees, seawater, and more, providing "ground truth" for satellites that scanned the entire planet. Hundreds of researchers penetrated remote jungles and ice caps, while hundreds more studied the biochemistry of soils, water, and air in their laboratories. | |
| Meanwhile the level of CO2 in the air kept rising, indeed faster than anyone had expected. Over the half-century up to 2015, emissions of CO2 had quadrupled. Efforts to reduce use of fossil fuels did begin to take effect. After 2015 emissions reported by national authorities rose slowly globally, and started to fall in the United States and Western Europe. Of course, the gas would continue to accumulate in the atmosphere so long as there were any human emissions at all. For decades the rise had in fact been accelerating, perhaps because natural systems were absorbing carbon less efficiently. |
|
| That put a spotlight on how natural systems absorbed or emitted carbon. The fraction of CO2 emissions taken up by the oceans plus land reservoirs had stayed steady at about half (to be exact, 55%). However, as the oceans got warmer and more acidic, they were not only less willing to take up CO2 but were leaking into the atmosphere molecules that had been stored in earlier centuries—evaporating roughly one pre-industrial CO2 molecule for every two newly-emitted molecules absorbed. Warming land ecosystems including soil, forests and wetlands might also be taking up carbon more slowly while emitting fossil carbon. | |
| From 2007 on, a massive interdisciplinary effort to pin down the global "carbon budget" engaged many scientists, most of them volunteering their time. Year by year they refined the numbers for sources and sinks of atmospheric carbon, gradually bringing the budget into closer balance. Many uncertainties persisted. For example, in 2026 calculations suggested that the total ocean sink, which had been considered a bit smaller than the total of land sinks over the long run, had actually been perhaps 15% bigger.(60a) | |
| In this essay we have seen how, ever since the late 1950s, an increasing number of experts predicted that effects on climate would become clearly visible around the year 2000. They were right. As the 21st century began, the global temperature was soaring in a way never seen before. (The rise in surface air temperature was irregular, but the oceans, where most of the heat energy was stored, warmed up steadily.) Worse, field evidence showed that the expected feedbacks were kicking in. The world's plants were taking up more CO2, but their capacity to absorb was waning. Warmer oceans were absorbing less CO2, and gas was seen bubbling from melting Arctic tundra. In sum, global warming was leading to more greenhouse emissions, which would lead to more warming... and so forth. Starting around 2008 some scientists began to warn that these changes were coming on faster than the international panels had predicted. "I have yet to meet a climate scientist," one of them remarked in 2012, "who does not believe that global warming is a worse problem than they thought a few years ago."(61) |
|
| Also as predicted only sooner, the world was beginning to suffer historically unprecedented heat waves, droughts, floods and storms. The sea level was rising while mountain glaciers, the Greenland and Antarctic ice sheets, and Arctic sea ice melted back, all at accelerating rates. Important ecosystems from alpine meadows to coral reefs were showing signs of stress. For the scientists, as one of them remarked, "Seeing their own predictions come true has been a frightening experience."(62) Some researchers turned from predicting future warming to identifying how far some of the extreme weather events of the 2000's could already be attributed to human-caused climate change. |
<=Impacts |
| Still more sobering, people were scarcely coming to grips with a fact that scientists had known for decades — the climate system has a built-in inertia. Even if emissions could magically be brought immediately to zero, the planet's uptake of CO2 was so slow that the gas already in the air would mostly stay there and keep the planet warm for a very long time. For example, in a milestone 1977 US National Academy of Sciences report, Keeling and a colleague reported that a decline of the level of CO2 in the atmosphere would take centuries. But scientists had rarely emphasized this to the public, and many people assumed that if emissions could be reined in the problem would be solved. A definitive report published in 2005 by the prestigious Intergovernmental Panel on Climate Change (IPCC) stated only that, "While more than half of the CO2 emitted is currently removed from the atmosphere within a century, some fraction (about 20%) of emitted CO2 remains in the atmosphere for many millennia." You could read that as implying that a large part of global warming would dwindle away within a century after emissions ceased. | |
| Wrong. The massive emissions were transforming the entire global carbon system into a new state. For decades experts like Hansen had warned that global temperature would not promptly decline if our emissions ceased. Some of the early work had even anticipated additional warming for a few decades. However, articles that emphatically explained the situation did not appear until 2007-2008. The IPCC’s 2014 report finally stated the problem baldly: "Surface temperatures will remain approximately constant at elevated levels for many centuries after a complete cessation of anthropogenic CO2 emissions." Whatever we did now, we were committed to decades of violently changing weather until we reached zero emissions, followed by a very long time in a state hot beyond anything in human experience.(63*) |
|
| How hot would that be? Two papers published in 2009 jolted scientists and, still more, policy-makers with a remarkably simple answer: you could calculate the temperature at the point you stopped emitting just by knowing the total sum of emissions up to that point. It made little difference where or when the gases were emitted. If we wanted to stabilize at a barely tolerable two degrees above 19th-century temperatures, the total of all our carbon emissions from the Industrial Revolution into the future must not exceed a trillion tonnes. As of 2009 about half of this "carbon budget" had already been spent. At current emission rates the rest would be used up by mid century. Indeed on a per capita basis the industrialized nations had long since overspent their fair share of the budget. Over the following decade these brutal facts bore down on politics and diplomacy, resulting in pledges to cut net emissions to zero by mid century.(64) |
Warming would be much greater than the 2°C global average at northern latitudes, and greater over land than over the oceans. |
| The basic physics and chemistry of the problems raised by Tyndall were now well in hand. There were reliable calculations of the direct effects of CO2 on radiation, of how the gas was dissolved in seawater, and other physical phenomena. Further progress would center on understanding the complex interactions of the entire planetary system, and especially interactions with living creatures. The creatures who would count the most were humans. The climate a century hence would depend chiefly on what they chose to do about their emissions. | |
| With warming now plainly underway, tortuous international negotiations culminated in the 2015 "Paris Agreement" with all the world's governments promising to set limits on their greenhouse gas emissions. If the promises were actually fulfilled, scientists calculated that by the end of the century the world would most probably be some 2.7°C hotter than in pre-industrial times. What would be the consequences of such heating? That became a new focus of scientific research. Extensive studies showed that the consequences of a rise of even two degrees would be severe. Indeed already at 1.5°C, which the planet approached around 2024 (much sooner than expected), climate-related disasters were hurting many millions of people. Unless the world stepped up its efforts sharply, we would face sweeping social and economic disruptions and a grievous degradation of the ecosystems on which civilization depends. | |
| Worse still: while news reports touted the 2.7°C number, the actual scientific reports were far less precise. Climate scientists agreed that the rise could be higher by a degree or even two. As the planet warmed, new forces might come into play. Indeed, already there was evidence that the forests and wetlands that we relied on to absorb a large fraction of our emissions were measurably taking up less carbon, or even becoming net emitters as they warmed. By 2025 human emissions were still growing, but slowly, while the curve showing the level of CO2 in the atmosphere was not only rising but accelerating. There was a real possibility that past some threshold, a cascade of self-reinforcing processes might gradually but irreversibly push the global system into an ancient ice-free "Hothouse Earth" state with temperatures far above what many species, including our own, are adapted to tolerate. |
|
| See the summary of expected Impacts of Climate Change | |

RCraig09, CC BY-SA 4.0, via Wikimedia
Average global temperatures, derived from millions of observations by five independent teams. A rise beginning at the start of the 20th century paused as smog and other pollution increased, but this effect was overtaken by the steady accumulation of carbon dioxide and other greenhouse gases in the atmosphere.
See also: graph of heat content of the oceans
RELATED:
— Home
The Modern Temperature Trend
Rapid Climate Change
Simple Models of Climate
Supplements:
Other Greenhouse Gases
Roger Revelle's Discovery
| NOTES |
1. Tyndall (1861). Tyndall measured what he called "carbonic acid" gas, what is now called carbon dioxide, see note in the essay on "Other Greenhouse Gases." Foote (1856), see Sorenson (2011) and Foote's paper in publicdomainreview.org. BACK
2. Högbom (1894) ; the essentials are quoted by Arrhenius (1896), pp. 269-73; see also Berner (1995); for further background, see Arrhenius (1997). The word "evaporating" was first used by Lotka in 1908, see Pilson (2006). BACK
3. He also did computations for 1.5-, 2.5- and 3-fold increases. Arrhenius (1896), 266; see Crawford (1996), chap. 10; Crawford (1997); reprinted with further articles in Rodhe and Charlson (1998). BACK
4. Nernst also noted that the additional CO2 would fertilize crops. James Franck, interview by Thomas Kuhn, p. 6, Archive for History of Quantum Physics, copies at AIP and other repositories. BACK
5. Arrhenius (1896); revised calculations, finding a somewhat lower effect, were given in Arrhenius (1901a) ; popularization: Arrhenius (1908), chap. 2. BACK
8. Ångström (1900), pp. 731-32; Abbot and Fowle (1908), pp. 172-73; for spectrographs, e.g., Weber and Randall (1932). An example of the conclusion that "Arrhenius's hypothesis evidently fails:"Very and Abbe (1901). BACK
9. Koch had only a thermocouple to measure heat across the entire infrared spectrum. He accurately reported that about 10% of the radiation from a 100°C black body was absorbed in his tube, and that at lower pressure at most 9.6% was absorbed, whereas in fact it must have been about 9%. For the modern calculation I thank Raymond T. Pierrehumbert. BACK
10. Fleming (2000), p. 301; for early measurements and additional background and references, see Mudge (1997). Ångström’s argument was immediately accepted in for example, Monthly Weather Review (1901). Response: Arrhenius (1901b). One leading expert dismissing CO2 because of saturation was Humphreys (1913), pp. 134-35, although while denying that doubling the amount in the atmosphere would "appreciably affect the total amount of radiation actually absorbed," he did note that it would "affect the vertical distribution or location of the absorption," Humphreys (1920), p. 58; on CO2 saturation, Schaefer (1905), p. 104. These scientists were overconfident in believing they understood radiation transfer. realistic calculations of how radiation interacts with gases could only come with the development of quantum theory in the 1930s, detailed infrared measurements in the 1940s, and digital computers in the 1950s. For a more complete technical account of the saturation fallacy, see the discussion by Raymond Pierrehumbert on realclimate.org. BACK
11. Hulburt (1931), quote p. 1876; note also Simpson (1928b), who finds CO2 adds a correction — but only a small one — to water vapor absorption. BACK
11a. Brooks (1951), p. 1016. BACK
12. Redfield (1958), 221. The atmospheric elements he addressed were oxygen and other elementary gases, not carbon. BACK
13. Hutchinson (1948), quote p. 228; see also Hutchinson (1954), 389-90; another example: Eriksson and Welander (1956), 155. BACK
14. (Obituary) (1965); Fleming (2007b). BACK
15. Callendar (1938); see also Callendar (1940); Callendar (1939); Callendar (1949). BACK
16. For bibliography on CO2 measurements and ideas to 1951, see Stepanova (1952); sheep: Woodman (1904); criticism: Slocum (1955); Fonselius et al. (1956) with graph; however, some evidence for a gradual increase was summarized by Junge (1958); measurements are reviewed by Bolin (1972); From and Keeling (1986). BACK
17. E.g., it "may require a period of [data] collection of many decades to detect the real trends" according to Eriksson and Welander (1956). BACK
21. Russell (1941), 94. BACK
22. Critic: G.C. Simpson. For additional discussion and references, see Fleming (2007b); Weart (1997). BACK
23. This section is condensed from a more detailed published study, Weart (1997). BACK
24. Martin and Baker (1932); for review, see Smith et al. (1968), pp. 476-483. BACK
25. Kaplan (1952); for other workers see, e.g., Möller (1951), pp. 46-47. BACK
26. Plass (1956); see also Plass (1956c). For a short technical summary of theoretical work from Arrhenius through Plass see Manabe and Broccoli (2020), ch. 2. BACK
27. Rossby (1959), p. 14; the chief critic was Kaplan (1960). BACK
28. Plass (1956), quotes on 306, 311, 315, 316; see also Plass (1959); Plass (1956); Plass (1956). Joseph Kaplan (head of US National Committee for the IGY) quoted in "Science Notes. Carbon Dioxide Due To Change Climate," New York Times, June 3, 1956. BACK
29. Plass (1956); Dingle (1954). BACK
29a. Edwards (2010) has discussion and references. BACK
30. Suess (1955); see also Suess (1953); a confirmation: Münnich (1957); Revision: Houtermans et al. (1967), see p. 68. BACK
31. Revelle and Suess (1957); Craig (1957a); Arnold and Anderson (1957). BACK
32. Revelle and Suess (1957), pp. 18-20, 26. BACK
33. Callendar (1958), p. 246. Here Callendar was one of those who quickly picked up Revelle's "geophysical experiment" phrase. A typical denial of any future greenhouse effect problem was Bray (1959), see p. 228. BACK
34. Bolin and Eriksson (1959); example of paper citing Bolin and Eriksson but not Revelle: Mitchell (1961), p. 243; review citing them: Skirrow (1965), pp. 282-84, 308. "Alarm bells:" Easterbrook (2023), p. 175. BACK
34a. Meeting of National Academy of Sciences described in "Experts Discuss Monsters of the Sea," New York Times, April 28, 1959; my thanks to Richard Somerville for pointing this out. BACK
35. G.F. Plass, "The Carbon Dioxide Theory of Climate Change," pp. 81-92 in Craig (1957b), p. 92; Revelle quoted in Time (1956); IPCC (2001b). BACK
36. Meteorologists understood: e.g., Mitchell (1961). Measure: e.g., Eriksson (1954). BACK
37. Fonselius et al. (1955); Fonselius et al. (1956); for critique, see From and Keeling (1986), p. 88, and passim for history of CO2 measurements generally; also Keeling (1998), p. 43. BACK
38. Rossby (1959), p. 15; this is a translation of Rossby (1956). BACK
39. The paper also described the seasonal cycle of CO2 emissions. Keeling (1960); in the 1970s, it was found that the 1959-1960 rise had been exaggerated by an unusual natural release of the gas related to an El Niño event. Keeling (1998); for the history, see also Keeling (1978). BACK
40. For example in the landmark "SMIC" report, Wilson and Matthews (1971), p. 234. BACK
41. Manabe and Wetherald (1967). BACK
42. President's Science Advisory Committee (1965); Hart and Victor (1993), passim. BACK
44. Lamb (1969), p. 245; Sawyer (1972). See Richard Betts, "Today Marks the 50th Anniversary of a Remarkable Research Paper on Global Warming," CarbonBrief.org, Sept. 1, 2022, online here. BACK
45. The partial pressure of CO2 in seawater would grow and the chemical buffering would change. Keeling (1973), p. 291. BACK
46. E.g., Keeling et al. (1976). BACK
46a. Wigley and Jones (1981), p. 208. BACK
47. Berner et al. (1980); Delmas et al. (1980); for the history of extraction from ice see
Petit and Raynaud (2020). Neftel et al.
(1982); Shackleton et al. (1983).
BACK
48. Lorius et al. (1985); see also Barnola et al. (1987); Genthon et al. (1987). Ice cores also gave an independent confirmation of Keeling's discovery of a recent rise (although nobody seems to have questioned Keeling's work), Neftel et al. (1985), q.v. for an interesting account of difficulties in measuring the concentration. The "consilience," as philosophers of science call such agreement, was already noted in the Greenland data by Hansen et al. (1984). BACK
49. Mayewski and White (2002), pp. 39, 77. BACK
51. Walker et al. (1981). On the "faint young Sun paradox" see note 17a in essay "Venus & Mars". BACK
52. Also, the discovery in the late 1970s that life is sustained at hot springs in the deep ocean showed that the continuous fossil record of sea life did not rule out the possibility that the oceans had frozen. Studies include Berner et al. (1983); Kasting and Ackerman (1986); for review, Crowley and North (1991); more recently, Hoffmann et al. (1998); the term "snowball Earth" was coined by Joseph Kirschvink Kirschvink (1992); earlier Manabe called it "White Earth" according to Gleick (1987), p. 332; for references and popular-level discussion, see Ward and Brownlee (2000) and, including more recent work, Mann (2023), ch. 2. BACK
53. Genthon et al. (1987); Petit et al. (1999). A more recent review: Sherwood et al. (2020), BACK
53a. Shackleton (2000). Global rise lagged: Shakun et al. (2012). See this note in the essay on "Past Climate Cycles." BACK
54. Severinghaus (2009), with a good discussion of some amplification effects. BACK
55. Petit et al. (1999); IPCC (2001a), p. 202; Lorius et al. (1990); Pälike et al. (2006) (detecting the carbon cycle feedback over millions of years). BACK
56. Barnett et al. (2005); Hansen et al. (2005). BACK
57. Paleoclimatology is a huge topic I have not covered adequately. See, e.g., Cronin (2009), a textbook. A few of the many studies: Berner (1991) (geochemical); Cerling (1991) (carbon in soils); McElwain and Chaloner (1995), Royer (2001) , (leaves), see Royer et al. (2001) and review by Royer et al. (2007); Eiler (2007) (clumping, a review); more recently, Martínez-Botí et al. (2015), Anagnostou et al. (2016), Friedrich et al. (2016). Warming "unprecedented:" Hoffert and Covey (1992), p. 576. BACK
57a. On positive feedbacks see Matthews and Keith (2007) and Tripati et al. (2009) (for mid Miocene); Hansen et al. (2008), popular version: Hansen (2009), ch. 8; on mid Pliocene conditions, Pagani et al. (2010) and Lunt et al. (2010). Breecker et al. (2010) offer new evidence on fossil soil chemistry showing that “past greenhouse climates were accompanied by concentrations [of CO2] similar to those projected for A.D. 2100". Another view: Kiehl (2011). BACK
58. Surveying papers published 1991-2011, Cook et al. (2013) found only 3% rejected the consensus. Scientific "contrarian" papers published in peer-reviewed journals 1998-2013 are reviewed, and the most common flaws identified, by Benestad et al. (2016). The pioneering study by Oreskes (2004) reviewing abstracts of papers published 1993-2003 found that "none of the papers disagreed with the consensus position." However, the common claim that "97% of scientists" accept the consensus is inaccurate. In a poll of scientists in different fields by Doran and Kendall Zimmerman (2009), 97% of those who published at least half of their peer-reviewed research in the climate field agreed that human activity was significant in changing global temperature; at the other extreme, only 47% of economic geologists (typically employed by oil companies and the like) concurred. Anderegg et al. (2010) similarly found that 97% of actively publishing climate scientists went along with the international panels' consensus. Surveys of publications after 2010 found that well over 99% tacitly accepted the consensus, usually as a fact not even worth mentioning, Powell (2015b), Powell (2016), reaching 100% of 11,602 peer-reviewed articles on "climate change" or "global warming" in 2019, Powell (2019). For a critical summary of surveys see Earl J. Ritchie, "Fact Checking the Claim of 97% Consensus on Anthropogenic Climate Change," Forbes.com (Dec. 14, 2016), online here. BACK
59a. R. Keeling et al. (1993); R. Keeling et al. (1996). Oxygen: R. Keeling and Shertz (1992). Forests: Pan et al. (2011). BACK
60. C. Keeling et al. (1995); Ghosh and Brand (2003); R. Keeling et al. (2010). BACK
60a. "Leaking into the atmosphere:" A. Sidder, "Tracing Anthropogenically Emitted Carbon Dioxide into the Ocean," Eos, 103 (Oct. 17, 2022), online here; see Holzer and DeVries (2022), Ballantyne et al. (2012). Growth rates to the present are reported here. Budget: McKinley (2025), Friedlingstein et al. (2026). BACK
61. Tundra: Canadell et al.(2007). Grantham (2011). BACK
62. Michael Oppenheimer at Fordham University conference on climate change, New York, Jan. 25, 2008. BACK
63. Keeling and Bacastrow (1977), pp. 80-82. The first clear explanation of ongoing warming was Hansen et al. (1984). IPCC (2007b), FAQ 10.3, pp. 824-25, online here. See also David Archer, "How long will global warming last?" RealClimate.org March 15, 2005, online here; he points out the climate community's poor grasp of the situation but does not emphasize that the temperature won't drop significantly for centuries. IPCC (2014a), p. 28, see p. 1004. Tyrrell et al. (2007): "It is frequently assumed that these impacts will fade away soon thereafter. Recent model results, by contrast, suggest that significant impacts will persist for hundreds of thousands of years after emissions cease;" Matthews and Caldeira (2008): "We show first that a single pulse of carbon released into the atmosphere increases globally averaged surface temperature by an amount that remains approximately constant for several centuries, even in the absence of additional emissions." See Inman (2008); Schmittner et al. (2008); James Hansen, privately circulated draft article on "Charney Effect" (2007). "I was struck by the fact that the warming continues much longer even after emissions have declined," said Schmittner, quoted by Juliet Eilperin, "Carbon Output Must Near Zero To Avert Danger, New Studies Say," Washington Post, March 10, 2008. Particularly influential (more than 4000 citations) was Solomon et al. (2009), warning that the climate change would be "largely irreversible for 1,000 years after emissions stop." Temperature leveling off: Matthews and Solomon (2013), see Myles et al. (2009). BACK
64. Allen et al. (2009), Meinshausen et al. (2009); for more see this note in the essay on International Cooperation. BACK
copyright © 2003-2026 Spencer Weart & American Institute of Physics