Tracking the world's average temperature from the late 19th century, people in the 1930s reported there had been a pronounced warming trend. During the 1960s, weather experts found that over the past couple of decades the trend had shifted to cooling. With a new awareness that climate could change in serious ways, in the early 1970s some scientists predicted a continued gradual cooling, perhaps a phase of a long natural cycle or perhaps caused by human pollution of the atmosphere with smog and dust. Others insisted that the effects of such pollution were temporary, and humanity's emission of greenhouse gases would bring warming over the long run. All of them agreed that their knowledge was primitive and any prediction was guesswork. But understanding of the climate system was advancing swiftly. The view that warming must dominate won out in the late 1970s as it became clear that the cooling spell (mainly a Northern Hemisphere effect) had indeed been a temporary distraction. When the rise continued into the 21st century, setting new records decade after decade, the heat penetrating even into the ocean depths, scientists realized that it signaled a profound change in the climate system. Individuals and groups committed to opposing action on climate change persistently tried to discredit the evidence of warming, and failed. Painstaking historical studies, using everything from ship logs to ice caps to ocean sediments to tree rings, proved that nothing like the recent rise had been seen for millennia. As for the cause, the specific patterns of temperature change acted as "fingerprints" that unambiguously matched the predicted effects of humanity’s greenhouse gas emissions.
| Subsections: Hints of Warming (1930s -1950s) - Warming or Cooling? (1960s-1974) - Warming Resumed (1975-1987) - Controversy (1988-1990s) - Fingerprints (1990s-2000s) - Hockey Stick and Hiatus |
"The subject... is a vast one, and
only too easily submerged in an ocean of repelling statistics, unless
firm measures are taken to reduce the mass of data into a form which
eliminates distracting or irrelevant detail..."
— G.S. Callendar(1)
| If you had a certain type of mind, temperature statistics could be more absorbing than a book of crossword puzzles. Ever since the invention of the thermometer, some amateur and professional scientists had recorded the temperature wherever they happened to be living or visiting. Government weather services began to record measurements more systematically during the 19th century. By the 1930s, observers had accumulated millions of numbers for temperatures at stations around the world.(1a) It was an endlessly challenging task to weed out the unreliable data, average the rest in clever combinations, and compare the results for each particular region with other weather features such as droughts. Many of the players in this game pursued a hope of discovering cycles of weather that could lead to predictions. Perhaps, for example, one could correlate rainfall trends with the eleven-year sunspot cycle. | - LINKS -
More discussion in |
| Hints of Warming (1930s-1950s) TOP OF PAGE | |
| Adding interest to the game was a suspicion that temperatures had generally increased since the late 19th century — at least in eastern North America and western Europe, the only parts of the world where reliable measurements went back so far.(2) In the 1930s, the press began to call attention to numerous anecdotes of above-normal temperatures. The head of the U.S. Weather Bureau's Division of Climate and Crop Weather responded in 1934. "With 'Grand-Dad' insisting that the winters were colder and the snows deeper when he was a lad," he said, "...it was decided to make a rather exhaustive study of the question." Averaging results from many stations in the eastern United States and some scattered locations elsewhere around the world, the weather services found that "Grand-Dad" was right: since 1865 average temperatures had risen several degrees Fahrenheit (°F) in most regions. Experts thought this was simply one phase of a cycle of rising and falling temperatures that probably ambled along for centuries. As one scientist explained, when he spoke of the current "climate change" he did not mean any permanent shift, but a long-term cyclical change "like all other climate fluctuations."(3) |
|
| It may have been the press reports of warming that stimulated an English engineer, Guy Stewart Callendar, to take up climate study as an amateur enthusiast. He undertook a thorough and systematic effort to look for historical changes in the average temperature of the entire planet. One 19th-century German had already made an attempt at this, seeking a connection with sunspot cycles. Otherwise, if anyone else had thought about it, they had probably been discouraged by the scattered and irregular character of the weather records, plus the common assumption that the average climate scarcely changed over the span of a century. But since the late 19th century meteorologists around the world had been meticulously compiling weather records, and had spent countless hours negotiating standards so the data from different countries and different years could be compared on the same basis. Callendar drew upon that massive international effort. After countless hours of sorting out data and penciling sums, he announced that the mean global temperature had definitely risen between 1890 and 1935, by close to half a degree Celsius (0.5°C, equal to 0.9°F).(4) |
|
| Callendar's statistics gave him confidence to push ahead with another and more audacious claim. Reviving an old theory that human emissions of carbon dioxide gas (CO2) from burning fuel could cause a "greenhouse effect," Callendar said this was the cause of the warming. (For the details of the theory, click on the link in the righthand column from the essay on Simple models of climate. For scientists' views on the theory in Callendar's day, click on the link higher up to the essay on the CO2 greenhouse effect.) |
|
| It all sounded dubious to most meteorologists. Temperature data were such a mess of random fluctuations that with enough manipulation you could derive all sorts of spurious trends. Taking a broader look, experts believed that climate was comfortably uniform. "There is no scientific reason to believe that our climate will change radically in the next few decades," the highly respected climatologist Helmut Landsberg explained in 1946. "Good and poor years will occur with approximately the same frequency as heretofore."(5) If during some decades in some region there was an unmistakable climate change, the change must be just part of some local cycle, and in due time the climate of the region would revert to its average. |
|
| (By the end of the 20th century, scientists were able to check Callendar's figures. They had done far more extensive and sophisticated analysis of the weather records, confirmed by "proxy" data such as studies of tree rings and measurements of old temperatures that lingered in deep boreholes. The data showed that the world had in fact been warming from the mid 19th century up to about 1940. As it happened, much of the warming had been in the relatively small patch of the planet that contained the United States and Europe — and thus contained the great majority of scientists and weather records. If not for this accident, people might have paid little attention to the idea of global warming for another generation. That would have severely delayed our understanding of what we face.) |
|
| During the 1940s only a few people looked into the question of warming. A prominent example was the Swedish scientist Hans Ahlmann. Studies of retreating glaciers between the wars had convinced him that a strong "polar warming" was underway. He thought this involved some kind of change in circulation patterns; like most of his colleagues Ahlmann found a greenhouse effect implausible. All the more so when, in 1952, he reported that around 1940 northern temperatures had begun to fall again.(6) In 1949 another eminent climatologist, C.E.P. Brooks, wrote that the argument for warming caused by CO2 emissions "has rather broken down in the last few years" when temperatures in some regions fell. However, scarcely a year later Brooks allowed that since 1850 glaciers had been in retreat, and noted that "Winter temperatures rose over a large part of the northern hemisphere."(7) In any case (as yet another authority remarked), compared with the vast slow swings of ice ages, "the recent oscillations of climate have been relatively small."(8) | |
| If the North Atlantic region was no longer warming, through the 1940s and 1950s it remained balmy in comparison with earlier decades. People were beginning to doubt the assumption of climate stability. Several scientists published analyses of weather records that confirmed Callendar's finding of an overall rise since the 1880s.(9) An example was a careful study of U.S. Weather Bureau data by Landsberg, who was now the Bureau's chief climatologist. The results persuaded him to abandon his belief that the climate was unchanging. He found an undeniable and significant warming in the first half of the century, especially in more northern latitudes. He thought it might be due either to variations in the Sun's energy or to the rise of CO2.(10) Others pitched in with reports of effects plain enough to persuade attentive members of the public. Ahlmann for one announced that glaciers were retreating, crops were growing farther north, and the like.(11) Another striking example was a report that in the Arctic "the ice is thinner at the present than ever before in historic times;" before long we might even see an open polar sea.(12) Such high-latitude effects were exactly what simple models suggested would result from the greenhouse effect warming of increased CO2. |
=>Aerosols |
| "Our attitude to climatic 'normals' must clearly change," wrote the respected climate historian Hubert H. Lamb in 1959. Recent decades could not be called normal by any standard of the past, and he saw no reason to expect the next decades would be "normal" either. Actually, since the 1930s the temperatures in his own homeland, Britain, had been heading down, but Lamb would not speculate whether that was the start of a cyclical downtrend. It could be "merely another wobble" in one region. Lamb's main point, reinforced by his scholarly studies of weather reports clear back to medieval times, was that regional climate change could be serious and long-lasting.(13) Most meteorologists nevertheless stuck to their belief that the only changes to be expected were moderate swings in one part of the world or another, with a fairly prompt return to the long-term average. If there was almost a consensus that for the time being there was a world-wide tendency to warming, the agreement was fragile. |
|
| Warming or Cooling? (1960s-1974) TOP OF PAGE | |
| In January 1961, on a snowy and unusually cold day in New York City, J. Murray Mitchell, Jr. of the U.S. Weather Bureau's Office of Climatology told a meeting of meteorologists that the world's temperature was falling. Independently of Callendar (who had meanwhile been updating and improving his own global temperature history), Mitchell had trudged through all the exacting calculations, working out average temperatures for most of the globe, and got plausible results. He confirmed that global temperatures had risen until about 1940. But since then, he reported, temperatures had been falling. There was so much random variation from place to place and from year to year that the reversal to cooling had only now become unambiguous.(14*) |
|
| Acknowledging that the increasing amount of CO2 in the atmosphere should give a tendency for warming, Mitchell tentatively suggested that smoke from recent volcanic eruptions and perhaps cyclical changes in the Sun might partly account for the reversal. (Later studies confirmed that volcanoes, and possibly a decline in solar activity, probably did have some cooling effect around that time.) But he rightly held that "such theories appear to be insufficient to account for the recent cooling," and he could only conclude that the downturn was "a curious enigma." He suspected the cooling might be part of a natural "rhythm," a cycle lasting 80 years or so.(15) The veteran science correspondent Walter Sullivan was at the meeting, and he reported in the New York Times (January 25 and 30, 1961) that after days of discussion the meteorologists generally agreed on the existence of the cooling trend, but could not agree on a cause for this or any other climate change. "Many schools of thought were represented... and, while the debate remained good-humored, there was energetic dueling with scientific facts." The confused state of climate science was a public embarrassment. |
|
| Through the 1960s and into the 1970s, the average global temperature remained relatively cool. Western Europe in particular suffered some of the coldest winters on record. (Studies in later decades found that a quasi-regular long-term weather cycle in the North Atlantic Ocean had moved into a phase in the 1960s that encouraged Arctic winds to move southward there.)(16) People, including scientists, will always give special attention to the weather that they see when they walk out their doors, and what they saw made them doubt that global warming was at hand. In the early 1970s, wherever climate experts got together they debated whether the world was due to get warmer or cooler. Callendar found the turn worrisome, and contacted climate experts to discuss it.(17) Landsberg returned to his earlier view that the climate was probably showing only transient fluctuations, not a rising trend. While pollution and CO2 might be altering the climate in limited regions, he wrote, "on the global scale natural forces still prevail." He added, however, that "this should not lead to complacency" about the risk of global changes in the distant future.(18) |
|
| One source of confusion was increasingly debated. Weather watchers had long recognized that the central parts of cities were distinctly warmer than the surrounding countryside. In urban areas the absorption of solar energy by smog, black roads and roofs, along with direct outpouring of heat from furnaces and other energy sources, created an "urban heat island" effect. This was the most striking of all human modifications of local climates. It could be snowing in the suburbs while raining downtown.(19) Some people pushed ahead to suggest that as human civilization used ever more energy, in a century or so the direct output of heat could be great enough to disturb the entire global climate.(20) If so, that would not happen soon, and for the moment the main consequences were statistical. | |
| Some experts began to ask whether the warming reported for the decades before 1940 had been an illusion. Most temperature measurements came from built-up areas. As the cities grew, so did their local heating, which might have given a spurious impression of global warming.(21*) Callendar and others replied that they were well aware of urban effects, and took them fully into account in their calculations. Mitchell in particular agreed that population growth could explain the "record high" temperatures often reported in American cities — but it could not explain the warming of remote Arctic regions.(22*) Yet the statistical difficulties were so complex that the global warming up to 1940 remained in doubt. Some skeptics continued to argue that the warming was a mere illusion caused by urbanization. | |
| While neither scientists nor the public could be sure in the 1970s whether the world was warming or cooling, people were increasingly inclined to believe that global climate was on the move, and in no small way. The reassuring assumption of a stable "normal" climate was rarely heard now. In the early 1970s, a series of ruinous droughts and other exceptionally bad spells of weather in various parts of the world provoked warnings that world food stocks might run out. Fears increased that somehow humanity was at fault for the bad weather — if we were not causing global warming with greenhouse gases, then perhaps we were cooling the globe with our smoke and smog. Responding to public anxieties, in 1973 the Japan Meteorological Agency sent a questionnaire to meteorological services around the world. They found no consensus. Most agencies reported that they saw no clear climate trend, but several (including the Japanese themselves) noted a recent cooling in many regions. Many experts thought it likely that the world had entered a long-term cool spell.(23) |
|
| Public pressure was urging scientists to declare where the climate was going. But they could not do so without knowing what caused climate changes. Haze in the air from volcanoes might explain some cooling, but not as much as was observed. A few experts worried that pollution from human sources, such as dust from overgrazed lands and haze from factories, was beginning to shade and cool the planet's surface. But most experts doubted we were putting out enough air pollution to seriously affect global climate. A more acceptable explanation was a traditional one: the Earth was responding to long-term fluctuations in the Sun's output of energy.(24) |
|
| An alternative explanation was found in the "Milankovitch" cycles, tens of thousands of years long, that astronomers calculated for minor variations in the Earth's orbit. These variations brought cyclical changes in the amount of sunlight reaching a given latitude on Earth. In 1966, a leading climate expert analyzed the cycles and predicted that we were starting on the descent into a new ice age.(25) In the early 1970s, a variety of measurements pinned down the nature and timing of the cycles as actually reflected in past climate shifts. Projecting the cycles forward strengthened the prediction. A gradual cooling seemed to be astronomically scheduled over the next few thousand years. Later and better calculations would make that tens of thousands of years, but at the time a few people speculated that we might even see substantial natural cooling within centuries.(26) Unless, that is, something intervened. |
|
| Warming Resumed (1975-1987) TOP OF PAGE | |
| It scarcely mattered what the Milankovitch orbital changes might do, wrote Murray Mitchell in 1972, since "man's intervention... would if anything tend to prolong the present interglacial." Human industry would prevent an advance of the ice by blanketing the Earth with CO2. A panel of top experts convened by the National Academy of Sciences in 1975 tentatively agreed with Mitchell. True, in recent years the temperature had been dropping (perhaps as part of some unknown "longer-period climatic oscillation"). And industrial haze might also have a cooling effect, perhaps reinforcing the natural long-term trend toward a new ice age. Nevertheless, they thought CO2 "could conceivably" bring half a degree of warming by the end of the century.(27) The outspoken geochemist and oceanographer Wallace Broecker went farther. Referring to some recent data from Greenland ice cores, he suspected that there was indeed a natural cycle responsible for the cooling in recent decades (perhaps originating in cyclical changes on the Sun). If so, it was only temporarily canceling the greenhouse warming. Within a few decades that would climb past any natural cycle. Although it turned out he was wrong about the natural cycle, this was one of several occasions when Broecker's scientific instincts about general processes were better than his specific calculations. (Something was indeed temporarily masking greenhouse warming: a rapid increase in global air pollution.) Introducing a new phrase to scientists, Broecker asked, "Are we on the brink of a pronounced global warming?"(28*) |
|
| Meanwhile in 1975, two New Zealand scientists reported that while the Northern Hemisphere had been cooling over the past thirty years, their own region, and probably other parts of the Southern Hemisphere, had been warming.(29) There were too few weather stations in the vast unvisited southern oceans to be certain, but other studies tended to confirm it. The cooling since around 1940 had been observed mainly in northern latitudes. Perhaps cooling from industrial haze counteracted the greenhouse warming there? After all, the Northern Hemisphere was home to most of the world's industry. It was also home to most of the world's population, and as usual, people had been most impressed by the weather where they lived.(30*) |
|
| The tendency of some scientists in the early 1970s to suspect that the world was cooling now collapsed. Science journalists reported that climate scientists were openly divided, and those who expected warming were increasingly numerous. A good example is Hubert Lamb, the historian of climate who in the 1950s had called attention to climate changes without attempting to predict them. Generalizing from the unusually good historical records in his native England, Lamb had depicted a globally warm "Medieval Climatic Optimum" followed in the early modern period by a "Little Ice Age." During the chilly 1960s he was persuaded by the studies of natural cycles that a new ice age was likely to arrive over thousands of years. But after the hot English summer of 1976 he joined the emerging viewpoint that human greenhouse gas emissions would "become dominant over the natural climate fluctuations by about A.D. 2000."(31) |
|
| In an attempt to force scientists to agree on a useful answer, in 1977 the U.S. Department of Defense persuaded two dozen of the world's top climate experts to respond to a complicated survey. Their main conclusion was that scientific knowledge was meager and all predictions were unreliable. The panel was nearly equally divided among three opinions: some thought further cooling was likely, others suspected that moderate greenhouse warming would begin fairly soon, and most of the rest expected the climate would stay about the same at least for the next couple of decades. Only a few thought it probable that there would be considerable global warming by the year 2000.(31a) |
|
| Government officials and scientists wanted more definite statements on what was happening to the weather. Thousands of stations around the world were turning out daily numbers, but these represented many different standards and degrees of reliability — a disorderly, almost indigestible mess. Just storing the records was a formidable challenge. Already in 1966, "From storage rooms to hallways, punch card file cabinets containing the nation’s archive of climate data filled every conceivable space at the National Weather Records Center (NWRC)... There was concern that the NWRC building was in imminent danger of a structural collapse." Although computer memory storage technology improved with tremendous speed, the ever-increasing volume of data kept pace.(31b) | |
| Around 1980 two groups undertook to work through the mass of numbers in all their grubby details, rejecting sets of uncertain data and tidying up the rest. To contrive an entirely fictional example, suppose in the 1910s there were only eight stations measuring temperatures across a million square miles of the Canadian Arctic, and six of them were in the southern half of the territory. How do you combine the numbers to get an average for that entire segment of the globe? If one of the stations was moved in 1915 from a riverbank to a higher point that was usually colder, how do you adjust? What if one of the stations gave inconsistent results in the winter, and you suspect that the fellow stationed there didn't care to go out to read the thermometer on really cold days, but made up the numbers? The final values for an average temperature in a region resulted from countless difficult decisions. | |
| One of the groups that undertook the task was in New York, funded by NASA and led by James Hansen. They understood that the work by Mitchell and others mainly described the Northern Hemisphere, since that was where the great majority of reliable observations lay. Sorting through the more limited temperature observations from the other half of the world, they got reasonable averages by applying the same mathematical methods that they had used to get average numbers in their computer models of climate. (After all, Hansen remarked, when he studied other planets he might judge the entire planet by the single station where a probe had landed.) In 1981, the group reported that "the common misconception that the world is cooling is based on Northern Hemisphere experience to 1970." Just around the time that meteorologists had noticed the cooling trend, such as it was, it had apparently reversed. From a low point in the mid 1960s, by 1980 the world had warmed some 0.2°C.(32) | |
| Hansen's group looked into the causes of the fluctuations, and they got a rather good match for the temperature record using volcanic eruptions plus solar variations. Greenhouse warming by CO2 had not been a major factor (at least, not yet). More sophisticated analyses in the 1990s would eventually confirm these findings. From the 1940s to the early 1960s, the Northern Hemisphere had indeed cooled while temperatures had held roughly steady in the south. Some of the cooling was probably due to natural variations, including changes in the Sun's output, a modest spate of volcanic eruptions including Mt. Agung in 1963, and an irregular cycle of warming and cooling in the Pacific Ocean (the PDO, see below). And some of the cooling was later found to be spurious, a result of measurement errors (see below). More significantly, a sharp increase in haze from pollution such as sulfate aerosol particles had blocked enough sunlight to temporarily cool the industrialized Northern Hemisphere, masking the greenhouse warming. After the 1960s, with pollution growing less rapidly while CO2 continued to accumulate in the air, warming resumed in both hemispheres.(32a) |
|
| The temporary northern cooling had been bad luck for climate science. By feeding skepticism about the greenhouse effect, while provoking a few scientists (and rather more journalists) to speculate publicly about the coming of a new ice age, the cool spell gave the field a reputation for fecklessness that it would not soon live down. |
|
| So long as global pollution from smoke, smog and dust was increasing, its cooling effects would hold back some of the temperature rise. Furthermore, as a few scientists pointed out, the upper layer of the oceans must have been absorbing heat. This too was hiding the buildup of heat energy trapped by greenhouse gases in the air. For only ten percent of the heat added through the greenhouse effect went into heating up the atmosphere; nearly all the rest quickly sank into the oceans. However, Hansen's group and others calculated that these effects could delay atmospheric warming by no more than a few decades. His group boldly predicted that considering how fast CO2 was accumulating, by the end of the 20th century "carbon dioxide warming should emerge from the noise level of natural climatic variability." An increasing number of other scientists using different calculations were coming to the same conclusion — the warming would show itself clearly sometime around 2000. A few scientists had already said as much as far back as the 1950s.(33*) |
<=>The oceans
=>Government
|
| The second important group analyzing global temperatures was the British government's Climatic Research Unit (CRU) at the University of East Anglia, founded by Lamb in 1971 and now led by Tom Wigley. Help in assembling data and funding came from American scientists and agencies. The British results agreed overall with the NASA group's findings — the world was getting warmer. In 1982, East Anglia confirmed that the Northern Hemisphere cooling that began in the 1940s had turned around by the early 1970s. 1981 was the warmest year in a record that stretched back a century.(34*) Returning to old records, in 1986 the group produced the first truly solid and comprehensive global analysis of average surface temperatures, including the vast ocean regions, which most earlier studies had neglected. They confirmed that there had been considerable warming from the late 19th century up to 1940, followed by some regional cooling in the Northern Hemisphere. Global conditions had been roughly level until the mid 1970s. Then the warming had resumed with a vengeance. The warmest three years in the entire 134-year record had all occurred in the 1980s.(35*) |
= Milestone |
| Convincing confirmation came from Hansen and a collaborator. They too analyzed records going back a century, combining data from different meteorological stations using methods quite different from the British. They came up with substantially the same results. It was true: there had been an unprecedented warming, at least 0.5°C since the late 19th century. In later years Hansen's group would keep their work up to date, creating the ongoing NASA global temperature record that became a regular staple of scientific studies and media reports (see below). The British also began to calculate global temperature every year, joined later by other groups which all reported essentially the same rise.(36) |
|
| In such publications, the few pages of text and numbers were the visible tip of a prodigious unseen volume of work. Many thousands of people in many countries had spent most of their working lives carefully measuring the weather. Thousands more had devoted themselves to organizing and administering the programs, improving the instruments, standardizing the data, and maintaining the records in archives. In geophysics not much came easily. One simple sentence (like "last year was the warmest year on record") might be the distillation of the labors of a multi-generational global community. And it still had to be interpreted.(36a) |
|
| Most experts saw no solid proof that continued warming lay in the future. After all, reliable records covered barely a century and showed large fluctuations (especially the 1940-1970 dip). Couldn't the current trend be just another temporary wobble? Stephen Schneider, one of the scientists least shy about warning of climate dangers, acknowledged that "a greenhouse signal cannot yet be said to be unambiguously detected in the record." Like Hansen and some other scientists, he expected that the signal would emerge clearly around the end of the century, but not earlier.(37) | |
| Controversy (1988-1990s) TOP OF PAGE |
|
| Knowledge of the global temperature record was becoming so important (and to some, controversial) that the work by the groups in New York and East Anglia no longer seemed enough. A new major effort to track the trends was starting up at NOAA's National Climatic Data Center in Asheville, North Carolina. The Center had been established in 1951 as the National Weather Records Center, with the task of organizing the data that the Weather Bureau and military services had accumulated since the 1940s. The staff had assembled the world's largest collection of historical weather records. A team led by Thomas Karl began to tediously review the statistics for the world and especially the United States. Making their own decisions about how to combine data, they got results that inevitably differed in minor details from what the other groups reported. But there was no disagreement about the recent general trend. (In 2006 the Japan Meteorological Agency would provide yet a fourth independent analysis, confirming the others; in 2012 a fifth effort began, Berkeley Earth.) | |
| Each of the three groups began to issue annual updates, which the press reported prominently. When all the figures were in for 1988, the year proved to be a record-breaker (the 1980s now included the four warmest years since global measurements began). But in the early 1990s, average global temperatures dipped. Most experts figured the cause was the huge 1991 Pinatubo volcanic eruption, whose emissions dimmed sunlight around the world. After rains washed out the volcanic aerosols, the temperature rise resumed. 1995 was the warmest year on record, but 1997 topped it. 1998 beat that in turn by a large margin. Of course these were global averages of trends that varied from one region to another. The citizens of the United States, and in particular residents of the East Coast, had not felt the degree of warming that came in some other parts of the world — if they had, the politics of the matter might have been different. But looking at the world as a whole, in the late 1990s the great majority of experts at last agreed. Yes, a serious warming trend was underway.(38*) |
|
| This consensus was sharply attacked by a few scientists. Some pulled out the old argument that the advance of urbanization was biasing temperature readings. In fact, around 1990 meticulous re-analysis of old records had squeezed out the urban heat-island bias to the satisfaction of all but the most stubborn critics. Moreover, long-term warming trends showed up in various kinds of data measured far from cities — in particular, over the oceans. The global warming trend was no statistical error. Meanwhile, in urban areas whatever global warming the greenhouse effect might be causing did get a strong addition of heat, and the combination would significantly raise the mortality from heat waves.(39*) | |
| With the urbanization argument discredited, the skeptics turned to measurements by satellites that monitored the Earth's microwave radiation. Since 1975, when the first of these satellites was launched, they had provided the first truly comprehensive set of global temperature data. The instruments did not measure temperatures on the surface,however, but across broad layers at middle heights in the atmosphere. At these levels, according to an analysis by a group at the University of Alabama, Huntsville, there had been no rise of temperature, but instead a slight cooling. The satellites were designed for observing daily weather fluctuations, not the average that represented climate, and it took an extraordinarily complex analysis to get numbers that showed long-term changes. The analysis turned out to have pitfalls. What began as a normal controversy among scientists about the best way to analyze data became politicized, as if this one set of observations could prove or disprove that the planet was warming.(40) |
|
| In an attempt to settle the controversy, a panel of the National Academy of Sciences conducted a full-scale review in 1999. The panel concluded that the satellites seemed reliable (balloon measurements, although far less comprehensive, also failed to find warming in mid-atmosphere). The satellite instruments simply were not designed to see the warming that was indeed taking place at the surface. |
|
| The measurements indicating that middle layers of the atmosphere had not noticeably warmed were embarrassing to the scientists who were constructing computer models of climate, for their models predicted significant warming there. They suspected the discrepancy could be explained by temporary effects — volcanic eruptions such as Pinatubo, or perhaps the chemical pollution that was depleting the ozone layer? While the skeptics persisted, most scientists believed that although the computer models were surely imperfect, the satellite data analysis was too ambiguous to pose a serious challenge to the consensus that global warming was underway. This hunch would be confirmed in 2004 when meticulous analysis of both satellite and balloon observations turned up systematic errors. The mid levels had in fact been warming.(41*) |
|
| It was one of several cases where computer modelers had been unable to tweak their models until they matched data, not because the models were bad but because the observations were wrong. To be precise, the raw data were fine, but numbers are meaningless until they are processed; it was the complex analysis of the data that had gone astray. "This is the answer — I wish we had recognized it ourselves," said the chair of the 1999 Academy survey. In the public sphere, deniers of global warming continued to cite the satellites and other erroneous data; once an idea gets on the internet it can never be removed from circulation. | |
| By the late 1990s, many types of evidence showed a general warming at ground level. For example, the Northern Hemisphere spring was coming on average a week earlier than in the 1970s. This was confirmed by such diverse measures as earlier dates for bud-break in European botanical gardens, and a decline of Northern Hemisphere snow cover in the spring as measured in satellite pictures. But the most fundamental indicator, as experts knew, was the temperature of the upper layers of the oceans — that was where nine-tenths of the heat energy entering the climate system wound up. Analysis of countless volumes of ship data found serious heating in recent decades.(42*) Overall, the 1990s were unquestionably the warmest decade since thermometers came into common use, and the trend was accelerating. |
|
| Fingerprints (1990s-2000s) TOP OF PAGE | |
| Most climate scientists now took it for granted that greenhouse gases were the cause of the global warming, but critics pointed out that other things might be at work. After all, the greenhouse effect could not have been responsible for much of the warming that had come between the 1890s and 1940, when industrial emissions had still been modest. Announcements that a given year was the warmest on record, when the record had started during the 19th-century cold spell, might not mean as much as people supposed. The warming up to 1940 (and the dip that followed until the 1970s) might have been caused by variations in the Sun's radiation or by random volcanic eruptions. Another influence was decades-long fluctuations in the atmosphere-ocean systems of the North Atlantic, Pacific, and Arctic regions, which drove gradual variations in regional weather patterns; these quasi-cyclical fluctuations had been suspected since the 1920s, but only started to become clear in the late 1990s. Until all the possible influences were sorted out, the cause of the warming since 1970 would remain controversial. |
|
| However, there were "fingerprints" (or a “signature”) that pointed directly to greenhouse warming. One measure was the difference of temperature between night and day. Tyndall had pointed out more than a century back that basic physics declared that the greenhouse effect would act most effectively at night, as the gases impeded radiation from escaping into space. Statistics did show that it was especially at night that the world was warmer. Overall, minimum temperatures were rising three times faster than maximum temperatures (bad news for farmers, since warm nights hurt crops threatened by drought).(42a) | <=Simple models |
| No less convincing, Arrhenius at the turn of the century, and everyone since, had calculated that the Arctic would warm much faster than other parts of the globe, as snow and ice that reflected the Sun's rays melted and exposed dark soil and water. Later studies showed that this "arctic amplification" was further amplified by other forces, including a more active circulation that transported heat and water vapor from the tropics toward the poles.(42b) (The amplification would be less effective in Antarctica, with its colossal year-round ice cover at high altitude, and in fact warming was seen there only around the coasts and on the peninsula that projected beyond the ice sheet.) Arctic warming was indeed glaringly obvious to scientists as they watched trees take over mountain meadows in Sweden and the Arctic Ocean's ice pack grow spectacularly smaller and thinner. Alaskans and Siberians didn't need statistics to tell them the weather was changing, when they saw trees and buildings sag as the permafrost that supported them melted. | |
| A team of computer modelers at the Lawrence Livermore Lab in California, led by Benjamin Santer, predicted that greenhouse gases would cause a particular geographical pattern of temperature change. It was different from what might be caused by other external influences, such as solar variations. The maps of observed changes did in fact bear a rough resemblance to the computers' greenhouse-effect maps. "It is likely that this trend is partially due to human activities," the researchers concluded, "although many uncertainties remain. Even before Santer's finding was published, it impressed the community of climate scientists. An important 1995 report by the world's leading experts (the Intergovernmental Panel on Climate Change, IPCC) offered the "fingerprint" as evidence that greenhouse warming was probably underway.(43) By 2006, when the warming had progressed considerably farther and the computer models were much improved, their judgment was confirmed. A thorough analysis concluded that there was scarcely a 5% chance that anything but humans had brought the pattern of changes observed in many regions of the world.(43a) |
|
| Meanwhile a variety of new evidence suggested that the recent warming was exceptional even if one looked back many centuries — another unambiguous fingerprint of human influence. Beginning in the 1960s, a few historians and meteorologists had labored to discover variations of climate by digging through historical records of events like freezes and storms. For example, had the disastrous harvest of 1788 helped spark the French Revolution? Scholars found it difficult to derive an accurate picture, let alone quantitative data, from old manuscripts. Increasingly laborious projects hacked away at the problem.(43b) As one example among many, by the early 2000s an international group had analyzed hundreds of thousands of weather observations recorded in 18th and 19th century ships' logs in a dozen languages. Whaling ships in particular might have the only record for vast stretches of the planet. | |
| Analyzing old records was tricky. For example, ocean temperatures measured with a thermometer in a canvas bucket of seawater had to be adjusted for the cooling that took place as the bucket was hauled aboard. On the other hand, temperatures measured in the pipe where seawater was brought into a ship’s engine room were too warm by a fraction of a degree. It was necessary to dig out just how temperatures had been taken in every case. | |
| The effort paid off in 2008 when researchers discovered that a 1945 switch in the way measurements were analyzed had failed to account properly for the difference between buckets and pipes, That had caused a spurious drop in ocean temperature readings, which had exaggerated the global temperature dip of the 1950s. Moreover, in 2024 a study showed that sea surface temperatures during 1900-1930 were actually a bit warmer than earlier studies had calculated. Computer modelers who had been frustrated in attempts to get their simulations to match precisely the long-term curve of global temperature found they hadn't been far off after all — the models had been better than the data. The labor of reconciling different types of measurements seemed endless, but the magnitude of the errors was gradually beaten down.(44) | |
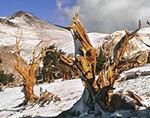
| For the distant past, tree rings in fossil wood were the most widely used measure — and therefore the most controversial. As early as the 1920s, a few scientists had used rings in ancient logs as a measure of past climates, claiming that the width of a ring varied with a season's rainfall. The studies were attacked as unreliable until the 1960s, when new research showed that the rings did track rainfall in dry regions, but elsewhere they varied according to other factors. In particular, temperature was the crucial factor for certain trees at high altitudes and high latitudes. For example, the venerable bristlecone pines of California survive for millennia on their bleak mountaintops like Taoist recluses in a Chinese painting, growing imperceptibly in close harmony with the changes of snow cover and sunlight. |
|
| Calibration was difficult, however, for some trees (although not the bristlecones) began to act strangely in the late 20th century, thanks perhaps to acid rain and other pollution as well as global climate change. This "divergence problem" could be worked around by relying on earlier data, but the adjustments were tricky. The adjustments became a lightning-rod for critics who insisted that the tree experts were analyzing the data incorrectly (even, some exclaimed, dishonestly). Fortunately there were other climate proxies, and scientists worked to derive past temperatures entirely without the use of tree rings. Ingenious analysis of coral reefs, fossil pollen, layers in stalactites, and so forth engaged experts from a variety of obscure specialties. Unexpected sources of error turned up here too. But years of analysis by different and often rival groups produced increasingly reliable numbers, all pretty much in agreement with one another and with tree rings. The trees proved useful as a check, and for exploring climate change in times and places where nothing else was available.(44a) | |
| A particularly telling independent proxy was a uniquely straightforward method, the measurement of old temperatures directly in boreholes. Data from various locations in Alaska, published in 1986, showed that the top 100 meters of permafrost was anomalously warm compared with deeper layers. The only possible cause was a rise of average Arctic air temperature by a few degrees since the last century, with the heat gradually seeping down into the earth.(45) In a burst of enthusiasm during the 1990s, scientists took the temperature of hundreds of deep boreholes in soil and rock layers around the planet. The averages gave a clear signal of a global warming accelerating in the 20th century. Boreholes were later largely forgotten, but at the time they provided an important addition to the contested evidence that global warming really was underway. |
|
| A still more important example of the far-flung efforts was a series of heroic expeditions that labored high into the thin air of the Andes and even Tibet, hauling drill rigs onto tropical ice caps. The hard-won data showed again that the warming in the last few decades exceeded anything seen for several thousand years. The ice caps themselves, which had endured since the last ice age, were melting away faster than the scientists could measure them.(46) |
|
| By 2005 glaciologists had
gathered enough evidence to report that everywhere from Argentina
to New Guinea, the majority of mountain glaciers and icecaps were
in retreat. As the ice melted back it was revealing mummies that
had been frozen for thousands of years. Striking changes in the
Alps, in Glacier National Park in the United States, and on Mount
Kilimanjaro in Africa made a particularly strong impression on
the public. But every glacier has its own personality, depending
as much on variations in snowfall as on temperature. What impressed
scientists were studies of the total mass of ice, which revealed
a net loss in every region of the globe.(47)
Loss of glaciers, ice caps and Arctic sea ice is a particularly visible (and worrying) demonstration of global warming. See the separate essay on Ice Sheets, Rising Seas, Floods. |
|


Global temperature - Average annual surface air temperatures, based on measurements by meteorological stations, ships and satellites. The number usually given for global warming is the mean overall rise since 1850-1900, currently about 1.5°C, but the land areas where people live are heating up much faster than the oceans.

Source: Berkeley Earth, for latest figures see also the NASA-GISS site |
| Hockey Stick and Hiatus TOP OF PAGE | |
| A group headed by Michael Mann combined a variety of measures to construct a graph of estimated temperatures averaged over the Northern Hemisphere over the past ten centuries. An apparent downward trend from a "Medieval Warm Period," roughly as warm as the 1950s, into the cooler "Little Ice Age" gave way to a steep rise in the 20th century. The movement from warm to cool and back toward warm had been debated by Lamb and other historians and climatologists since the 1920s; what was new and startling was the abrupt climb since the 1950s.(47a) A gray shaded area showed the range of incomplete data, but most attention went to a dark solid line showing temperatures averaged over each half-century or so. The temperatures of the 1990s soared to the top of the chart. Apparently 1998 had been not just the warmest year of the century, but of the millennium. The graph (shown below) was widely reprinted and made a strong impression. It was dubbed the "hockey stick" because it displayed a flat thousand-year trend followed by a sharp upward turn.(47b) |
|
| The "hockey stick" graph was prominently featured in a report the IPCC issued in 2001. The image immediately became a powerful tool for people who were trying to raise public awareness of global warming — to the regret of some seasoned climate experts who recognized that, like all science at the point of publication, the graph was preliminary and uncertain. The dedicated minority who denied that there was any global warming problem promptly attacked the calculations. For example, in 2003 a few scientists argued that the Earth had been as warm a thousand years ago as in the late 20th century.(48*) | |
| Other climatologists took up the question, looking at data for the entire world. They found a scattering of warm and cold periods in different places at different times, overall below the level of the recent general warming. It turned out that the supposed Medieval Warm Period had caught the eye of historical climatologists because it was prominent in well-studied parts of the Northern Hemisphere. (Greenland had been particularly warm. The Arctic in general, however, had been mostly cool until the steep rise of the late 20th century.) Textbooks replaced the phrase "Medieval Warm Period" with "Medieval Climate Anomaly." | |
| Other critics claimed that the recent warming was simply a "recovery" from the Little Ice Age. Studies inspired by the controversy found that the planet had indeed been slightly cooler on average a few centuries ago. Northern continental areas and a few southern regions had been particularly cold, but some other regions had been about as warm as at present. None of this was remotely as striking a global phenomenon as the recent rapid warming.(48a*) |
|
| Any lingering doubts were quashed in 2012-2013 with the publication of two definitive studies. One study, signed by 78 authors in a massive collaboration, used tree rings and other proxies in seven continental areas to check the findings of Mann's team. They found that the world at the opening of the 21st century was unquestionably warmer than at any time in the past two millennia. The other study used a variety of climate proxies from sea-floor sediments, plus some terrestrial ones, to get highly accurate data all the way back to the end of the last glacial period. Their graph showed a steep rise as the continental ice caps melted, followed by quite steady temperatures. For a while around six thousand years ago the planet seemed to have been slightly warmer than in the 19th century, but that was uncertain (later studies found it likely that the 2000s were warmer than any period in the last hundred thousand years). Beyond doubt was the 20th century’s abrupt hockey-stick-blade rise, shooting up above anything in human history (and on track to keep climbing). This recent rise was the only big globally coherent temperature excursion since the end of the ice age.(48b) | |
| Regardless of what had happened in past centuries, the warming since the 19th century was now as certain a fact as anything in science. A few critics continued to seek confirmation of their denial of the warming in data on air temperatures from weather stations and satellites. In particular, former TV weatherman Anthony Watts established a popular website that mobilized people to report continental U.S. weather stations that were poorly located, for example near the exhaust of air conditioners. A study by members of the NOAA National Climatic Data Center separately analyzed the sites that Watts's volunteers identified as faulty, comparing them with the acknowledged good sites. They found that any bias introduced by poor siting had been mostly compensated for by the data reduction, which was designed precisely to remove biases by comparisons over regions and time. Moreover, if the raw data only were considered, the poor sites did not tend to overestimate warming compared with what NOAA had reported, as Watts had assumed; if anything the warming from these sites was greater than NOAA's earlier figures.(49) | |
| The coup de grace for people who doubted the world was warming came from within their own ranks. Richard Muller, a physicist and outspoken skeptic of the temperature statistics, determined to make his own painstaking re-analysis of land-station data. He organized a team (dubbed Berkeley Earth) with funding from oil billionaire Charles G. Koch and others, funneled through groups that denied that global warming was a problem. Muller's team, using different methods and more data than earlier studies, ended by confirming them. In 2012 they announced there was indeed a marked rise that could only be explained as human-caused. Muller's honest work shut down the last nominally scientific criticism of temperature statistics. (Nevertheless, claims about flawed data would persist on the internet as unkillable "zombie arguments," occasionally catching a flurry of attention.)(49a) | |
| But never mind the surface temperatures. People dedicated to denying global warming retreated to an old claim based on a different dataset, the satellite measurements of mid-atmosphere temperatures (Christy and Spencer data, see above). A temperature graph based on convoluted analysis of the raw data, displayed even in the US Senate, had not risen above the 1998 peak. As before, the analysis was found to have problems that had concealed an actual rise compatible with the models. Anyway in 2015 even the uncorrected graph leaped above the 1998 peak.(49b) | |
| In any case geophysicists noted that the buildup of heat energy was obvious not just in the thin and variable atmosphere but in the huge masses of solid earth and rock sampled by boreholes. Still more unequivocal, the upper layers of water in ocean basins (which were gradually absorbing nine-tenths of the heat energy) showed another increasingly plain "signature" of recent warming. (See above and see graph below). The pattern roughly matched what computer modellers had expected would result from the accumulation of greenhouse gases in the air, but not warming from any other cause. (Submarine volcanoes, for example, would warm from the bottom, but the oceans were warming from the top down.) Deniers found a chance to question this too, when a paper was published in 2006 reporting that the oceans had cooled in the past few years. However, the authors soon admitted that they had made an embarrassing mistake in the way they had compared the data from older and newer instruments. It was just another example of the difficulties of interpreting science amid an uproar of politicized controversy.(49c) |
|
| On the other hand, nobody even tried to dispute that there had been a remarkable cooling of the stratosphere —as expected. Ever since the first solid computer model of greenhouse warming was published in 1967, scientists had known that as the lower atmosphere heated up, the higher levels would get colder. (The lower levels increasingly trapped heat radiation rising from the surface before it could reach the stratosphere, while the upper layer continued to radiate its own heat directly into space.) When stratospheric cooling was observed to be underway, scientists called it an unmistakable fingerprint of global warming, inexplicable except as a consequence of our greenhouse gas emissions.(49d*) | |
| Talk radio callers and right-leaning columnists continued to exclaim about one or another unusually cold winter in this or that locality. They pointed out that some regions showed no warming at all, notably the massive Antarctic ice sheet. This was no surprise, but an effect predicted as far back as 1981 by Stephen Schneider and a collaborator. Noting that the Southern Hemisphere was mostly ocean, which would tend to take up heat and delay the rise of atmospheric temperature in the region, they had warned that people "may still be misled... in the decade A.D. 2000-2010" by cool weather there. (It turned out, however, that this and later computer studies were too conservative: in the 2000s, regions around Antarctica began to show a bit of warming and significant loss of ice.) | |
| As the world-ocean took up heat it delayed the rise of atmospheric temperature by decades. A further time-lag was introduced by the sluggish response of forests and tundra as they adjusted to the changing conditions. The current climate was nothing like the heat people would experience in future decades, even if greenhouse gas emissions were rapidly reduced. Scientists understood this by the end of the 20th century, but most policy-makers had yet to grasp the implications — another dangerous time-lag.(50) |
|
| Around 2008 the deniers began to publicize a new claim: the world had supposedly gotten no warmer in the decade since 1998. Indeed that had been an extraordinarily warm year, for a "super El Niño" event, the strongest of the century, had pumped some extra heat from the Pacific Ocean into the atmosphere. No year since had been noticeably hotter (although 2005 and 2008 roughly matched it). While the claim excited comment among internet bloggers and some politicians, the actual scientific literature gave scant attention to such short-term fluctuations. Anyone who looked at the ten-year average of air temperatures near the surface — which was what the weather statistics measured — would see that the decade 2001-2010 was substantially hotter than the decade before, which was in turn hotter than the preceding decade, and so forth back to the 1970s. Indeed all of the ten warmest years on record had come since 1997. Moreover, if one figured in the effects of known fluctuations — volcanic eruptions (active in the 2000s), industrial aerosols (increasing from China and elsewhere), El Niños (largely absent in the 2000s), and solar activity (sharply declining in the 2000s) — what remained would have been a continued rise in temperature.) |
|
| Further news came from a clever analysis of satellite data for the high Arctic, a region that the standard compilations of global temperatures had left out for lack of comprehensive historical data. The high Arctic had recently been warming so rapidly that, if it had been included, the graph of mean global temperature would have risen about as fast as ever.(50a) | |
| Climate scientists also pointed out that the widely publicized measures reported only the surface temperature of the atmosphere. Some nine-tenths of the energy building up in the system was not stored in the thin air but in seawater, shuttling easily into and out of the atmosphere. There were now reliable measures of the upper ocean layers. And through the first decades of the 2000s, as in earlier decades, the heat content of the oceans was rising. Major multinational efforts to analyze historical data and gather new ocean data found that the warming of the upper levels was not only rising smoothly but ominously accelerating, exactly as computer models calculated. |
|
| To be sure, for more than a decade the most widely used graphs of surface temperatures had shown little rise above the unusual 1998 peak. But mathematical analysis reinforced what most experts assumed, and indeed would be plain to anyone eyeballing the graph of past temperatures: this was an ordinary fluctuation in the chronically irregular climate system, with no statistically significant deviation from the long-term rising trend. The people who publicly denied that there was any need to worry about global warming were increasingly relying on a narrow, sometimes disingenuous, selection of evidence while ignoring all the rest.(50b*) | |
| Yet the experts could not overlook the leveling off of the standard surface warming measures — the "pause" or "hiatus" as even some scientists called it — nor could they shrug off the public’s doubts. Researchers who had been preoccupied with century-long trends took up the question of short-term fluctuations in the climate system.The hiatus was "the hot climate topic of the year," a journal editor remarked, bringing "a surge of research and submissions." How much were temperatures changed by volcanic and industrial aerosols, by ocean fluctuations, by the Sun, and perhaps other influences? By 2014 the researchers converged on an understanding that each of these played a part, but the dominant role belonged to the oceans. |
|
| Computer models and observations agreed that cycles in the Atlantic, Pacific, and Southern Oceans were a main cause of the hiatus — and had probably also contributed to the hiatus in Northern Hemisphere warming from the 1940s into the 1970s. Among several different explanations of the details, the most prominent involved a decades-long cycle called the Interdecadal Pacific Oscillation (IPO) and the related Pacific Decadal Oscillation (PDO). The 2000s were a period of La Niña conditions (the opposite of El Niños) involving strong trade winds, indeed trade winds beyond anything in the historical record. The winds drove the surface waters in the tropics westward, bringing cold water to the surface in the eastern Pacific. That sucked heat out of the atmosphere to deposit it in the ocean. "When the trade wind strength returns to normal," warned one of the researchers, "...heat will quickly accumulate in the atmosphere. So global temperatures look set to rise rapidly out of the hiatus..."(51) |
<=>The oceans |
| Global temperatures did shoot up in 2015 with the aid of another super El Niño, reaching a landmark 1°C above pre-industrial conditions and ending any semblance of a surface temperature hiatus. In the following years global temperatures kept climbing to new record levels, touching 1.5°C above pre-industrial temperatures in 2024 with the boost of a modest El Niño. (Experts defined the "pre-industrial" temperature in various ways, but eventually settled on the mean during 1850-1900. Actually the industrial revolution was well underway by then, to say nothing of centuries of industrial-scale deforestation. If the baseline global temperature was set in the period 1300-1800, the modern rise would be roughly 0.1° higher than commonly reported.) | |
| If you compared the irregularly climbing curve of temperatures since the 1860s with the curves produced by computer models that calculated the effects of the rise of greenhouse gases with adjustments for volcanic eruptions and other aerosol pollution, variations in solar activity, and ocean cycles, the match was remarkably close within the known margin of observational error. Temperatures were now soaring much as scientists had been predicting, with increasing confidence, for half a century. (If some of the early projections turned out a bit off, that was largely because they had not correctly predicted future levels of industrial pollution and greenhouse gases.) Few could believe any longer that this was mere coincidence. By now the world’s community of experts had finally agreed that, beyond reasonable doubt, the strong global warming seen since the 1970s was primarily the work of humanity. In a 2007 consensus report, the IPCC went on to point to greenhouse warming as a likely cause of the more frequent and more intense summer heat waves and droughts, warmer winters, earlier springs, dwindling glaciers, and other changes that were increasingly seen... as predicted. | |
| Then came the 2010s, the hottest decade on record and arguably the hottest in a hundred thousand years. The driving force was displayed clearly in the early 2020s by satellite measurements of the radiation coming in from the Sun and the heat radiation going outward. There was an imbalance, pinned down in plain numbers. It was a bit above 1 watt per square meter—as if a 100-watt light bulb was burning above every ten by ten meter square of Earth’s surface. And the imbalance was accelerating at a rapid pace, doubling in just the past two decades, adding ever larger loads of heat energy to the climate system. | |
| Meanwhile strict regulations had begun to reduce the industrial pollution of the atmosphere. Scientists had long suspected that a cooling effect of pollution had "masked" some of the greenhouse heating, and that did seem to have been happening. In 2023-24, with an additional boost from a modest El Niño, global temperature leaped upward. Climbing far above all predictions, the rise "sent a wave of consternation through the scientific community." Analysis of temperature records showed that the rate of global warming, which had held fairly steady at around 0.2°C per decade since the 1970s, had indeed been much faster since the mid 2010s. Around the world people no longer needed statistical analysis to tell them global warming was underway; they only needed to step outside.(52) | |

The heat content of the upper layers of the world's oceans is the most comprehensive measure of changes in the temperature of the planet. For as new heat is added, far more goes into the oceans than into the thin atmosphere. Several independent analyses of hundreds of thousands of measurements show that the ocean heat content began a steady rise in the 1970s. That was just when greenhouse gas levels reached a level high enough to be important. The rise has accelerated and is now at double the rate before 2000. Some pauses in atmospheric warming that attracted public attention are not seen here. (For latest updates see NOAA's ocean heat content site.)
See Levitus et al.,
Geophysical Research Letters 39 (2012): L10603 [doi: 10.1029/2012GL051106].
Back to earlier text.
The 1999 "hockey stick" reconstruction of Northern
Hemisphere temperatures for the past 1000 years (relative to the
average of 1961-90); the dark line shows mean values and the
gray band, often overlooked, shows the range of uncertainty:

Below:
a more recent (1999) and more accurate reconstruction for the past 1300 years.
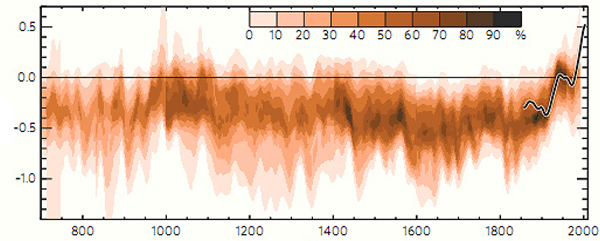
Northern
Hemisphere temperature data from ten 21st-century studies of tree rings
and a variety of other proxies are combined, with darker colors showing
areas of greater agreement. The black line 1850-2000 shows temperatures
recorded by thermometers. The
"Little Ice Age" of early modern times is evident in nearly
all studies. A "Medieval Warm Period" around 1000 AD is found
in some studies but not others.
Upper
graph: Mann et al. (1999), p. 761,
copyright © 1999 American Geophysical Union, reproduced by permission.
Lower graph: IPCC
(2007b) p. 467.
A graph of temperature from 1850 to the present is here.
The 1999 graph shows "proxy" temperatures (for example
from tree rings) averaged over the Northern Hemisphere, plus measured
temperatures for the past century. The dark solid line shows temperatures
averaged over each half-century or so, and the shaded area gives the
range of possible averages. The National Academy of Sciences
responded to the controversy by asking a panel to review all the evidence.
In 2006 the panel announced that while some mistakes had been made (as
usually happens in frontier science), the main original conclusions
held. The world had indeed grown warmer since the 1980s in a way that
was without precedent, at least in the past four centuries for which
a reliable record could be reconstructed. While earlier data were much
less reliable, the panel found it "plausible" that the world was now
hotter than at any time in the past millennium. For
yet more on the controversy see note 48*.
Back
to earlier text
For much more on the history and practice of recording temperatures, see Paul Edwards, A Vast Machine: Computer Models, Climate Data, and the Politics of Global Warming(Cambridge, MA: MIT Press, 2010).
RELATED:
Home
The Public and Climate
The Carbon Dioxide Greenhouse Effect
Changing Sun, Changing Climate
| NOTES |
1. Callendar (1961), p. 1. BACK
1a. For a summary history of global temperature measurements from early days to 2020 with references see IPCC (2021a), Section 1.3.1. BACK
2. One early notice was Brooks (1922). BACK
3. Kincer (1934), p. 62; "wie bei allen anderen Klimaschwankugen": Scherhag (1937), p. 263; similarly, "no evidence" of a permanent shift: George E. McEwen of Scripps, Science Newsletter (1940). BACK
4. Callendar (1938). Early attempt: Köppen (1873). On the "World Weather Records" see Le Treut et al. (2007), p. 101-102. BACK
5. Landsberg (1946), pp. 297-98. BACK
6. Abarbanel and McCluskey (1950), p. 23, see New York Times, May 30, 1947 and August 7, 1952; Sörlin (2011). BACK
7. Brooks (1949), p. 117; Brooks (March 1950), p. 113. BACK
8. Willett (1949), p. 50. BACK
9. In particular, Lysgaard (1950); this was cited by several authors in Shapley (1953); see also Willett (1950); on the shift of views, see Lamb (1966b), 171-72, also ix, 1-2. BACK
10. Landsberg (1958); his analysis found an average 0.8°F rise, more around the Great Lakes. Landsberg (1960). BACK
13. Lamb (1959), in Changing Climate (1966) p. 19. BACK
14. Mitchell was spurred by some Scandinavian studies showing a leveling off in the 1950s — the Arctic was usually where trends showed up first. Mitchell (1961); see also Mitchell (1963), "rhythm" p. 180. In his independent calculation, Callendar (1961) found chiefly a temperature rise in the Arctic. For another and similar temperature curve, computed by the Main Geophysical Observatory in Leningrad (and attributed to volcanoes), see Budyko (1969), p. 612. An expert called the works of Mitchell, Callendar (1961) and Budyko "the first reasonably reliable estimates of large scale average temperatures," Wigley et al. (1986), p. 278. One other attempt was Willett (1950). BACK
15. Mitchell (1961), pp. 249, 247. BACK
16. For the North Atlantic Oscillation, see Fagan (2000), esp. pp. 207-08. BACK
17. At a 1972 meeting in Stockholm, for example, there was an impasse between "the climate 'coolers' and the climate "warmers'," Kellogg (1987), pp. 122-23. Callendar: Lamb (1997), p. 218. BACK
18. Landsberg (1967); quote: Landsberg (1970), p. 1273; on all this, see Mitchell (1991). BACK
19. Brief reviews of observations back to the 19th century include Mitchell (1953); Landsberg (1955); Landsberg (1970). BACK
20. Budyko (1962); others such as Wilson and Matthews (1971) pp. 60, 166-68 agreed the effect could be serious. BACK
21. e.g., Dronia (1967), removing urban heat effects found no net warming since the 19th century. BACK
22. Mitchell (1953); already in 1938 Callendar adjusted for the effect, while admitting that "this is a matter which is open to controversy." Callendar (1938), p. 235. Additionally, the common practice during the 1950s of moving weather stations from downtown locations to airports, outside the "heat island," would give a spurious impression of cooling, but Mitchell and others allowed for that too in their calculations. BACK
23. Lamb (1977), pp. 709-10. BACK
24. Johnsen et al. (1970); Lamb (1977), pp. 529, 549. BACK
27. Mitchell (1972), p. 445; GARP (1975), pp. 37, 43; they cite a Manabe computer model of 1971 and Mitchell (1973). BACK
28. Broecker (1975). For more on Broecker's paper see the essay on solar variation; for the few obscure earlier uses of "global warming" see this footnote in the essay on The Public and Climate. BACK
29. Salinger and Gunn (1975). BACK
30. Damon and Kunen (1976); a brief argument on turbidity reducing high-latitude temperatures is in Bryson (1973), p. 9; see also Damon and Kunen (1978). A confirmation: Hansen et al. (1981). BACK
31. Lamb (1977), p. 698n1, citing a 1976 World Meteorological Organization statement (noted here). BACK
31a. National Defense University (1978); also published in Council on Environmental Quality (1980), ch. 17. BACK
31b. Edwards (2010); quote: Steurer (2007). BACK
32. Hansen et al. (1981), "misconception" p. 961, and Hansen, interview by Weart, Oct. and Nov. 2000, AIP. BACK
32a. For summary and references see Wild et al. (2007). BACK
33. Specifically, Hansen's group predicted the effect would rise above the two-sigma level in the 1990s. Hansen et al. (1981), "emerge" p. 957; another scientist who compared temperature trends with a combination of CO2, emissions from volcanic eruptions, and supposed solar cycles, likewise got a good match, and used the cycles to predict that greenhouse warming would swamp other influences after about 2000: Gilliland (1982b). Madden and Ramanathan (1980) studied the climate "noise" in comparison with warming predicted by various computer models and concluded the effect "should be detectable anytime from the present to about the year 2000," p. 767. Ocean calculations: Hoffert et al. (1980); Hansen et al. (1984). Already in 1956, both Gilbert Plass and Roger Revelle had expected an effect, if any existed, would be apparent by the end of the century. And in 1959 Bert Bolin said serious effects might be visible around then (see this note). On the other hand, in 1983 the editor of Nature, not a climate expert but no critic of greenhouse arguments, thought the effect would "become apparent only halfway through the next century" if not later, Maddox (1983). BACK
34. Jones et al. (1982), q.v. for a history of Russian and other earlier Northern Hemisphere surveys. The news for 1981 was added in proof in mid-December. For funding they thank the U.S. Dept. of Energy and Office of Naval Research. On American help with data, see e-mail interview of Raymond S. Bradley by Ted Feldman, 2000, copy at AIP. BACK
35. Jones et al. (1986a); Jones et al. (1986b); a review is Wigley et al. (1986). See recollections of Raymond Bradley on the AGU history site. Later analysis revealed that the dip had been less severe than their numbers showed, for a change in the way ocean temperatures were measured after 1945 had artificially lowered some numbers: Thompson et al. (2008). BACK
36. Hansen and Lebedeff (1987). The NASA record, now known as GISTEMP, comes from the Goddard Institute for Space Studies; the British record, HadCRUT, is issued by the Hadley Centre for Climate Prediction and Research in collaboration with the University of East Anglia's Climatic Research Unit.BACK
37. Schneider (1992), p. 26; Other examples: MacCracken and Luther (1985); Ramanathan (1988). BACK
38. There was strong U.S. warming 1976-2000, but only in the winter, not the summer warming that would have been noticeable. See IPCC (2001a), p. 117; Hansen et al. (2001). BACK
39. Study of the U.S., the only place where sufficiently good records were available, showed a large urban bias which, when removed, left a mild warming from 1900 to the 1930s. Karl and Jones (1989); Jones et al. (1990); irrigation and other changes in land use also contribute, making for a large total effect, according to Kalnay and Cai (2003). For a review of urbanization effects see Parker (2010). Another debate was over whether a reported sea-surface temperature rise in the 1980s was due to temporary distortions such as an El Niño event rather than the greenhouse effect, Reynolds et al. (1989); Robock and Strong (1989). BACK
40. Spencer and Christy (1990); Spencer and Christy (1992); Christy et al. (1997) with reply by K.E. Trenberth and J.W. Hurrell gives an idea of the technical problems of analysis; Christy et al. (1998); on Christy see Royte (2001); criticism: Wentz and Schabel (1998), finding that the Alabama group had neglected to include the effects of the satellite's gradual loss of altitude; Kerr (1998); for counter-arguments Singer (1999). BACK
41. National Academy of Sciences (2000); see also Santer et al. (2000); more recently, Santer et al. (2002); "claimed inconsistencies between model predictions and satellite tropospheric temperature data (and between the latter and surface data) may be an artifact of data uncertainties," suggested Santer et al. (2003). For the rest of the story see the essay on General Circulation Models here. BACK
42. Buds: Menzel and Fabian (1999); a more general biological indicator was the earlier arrival of the seasonal dip in CO2 as plants took up carbon: Keeling et al. (1996); snow and general discussion: Easterling et al. (2000); oceans: Levitus et al. (2000); oceans got some 30 times as much added heat as the atmosphere: Levitus et al. (2001), updated and improved by Levitus et al. (2005); Hansen et al. (2005) with better models and data found a particularly striking match between greenhouse effect computer model estimates and observed ocean basin warming. For more recent data see von Schuckmann et al. (2009). BACK
42a. Karl et al. (1991); Karl et al. (1993). BACK
42b. Reviews: Serreze and G.Barr (2011), Taylor et al. (2022). BACK
43. Santer et al. (1995); Santer et al. (1996), quote p. 39. Also influential, Hegerl et al. (1996) concluded, “a statistically significant externally induced warming has been observed.” For the subsequent controversy see Stevens (1999), ch. 13; Oreskes and Conway (2010), p. 199. BACK
43a. Allen et al. (2006). "In two out of three datasets," Santer wrote afterwards, "fingerprint detection at a 5-sigma threshold — the gold standard for discoveries in particle physics — (99.99994% confidence] — occurs no later than 2005," Santer et al. (2019). BACK
43b. Le Roy Ladurie (1967); Lamb (1972-77); Fagan (2000). BACK
44. Thompson et al. (2008); Chan et al. (2019); Sippel et al. (2024). BACK
44a. For pioneers in tree rings see Fritts (1976, rev. ed. 2001); for coral, Weber and Woodhead (1972). An overview is Le Treut et al. (2007), p. 102. BACK
45. Lachenbruch and Marshall (1986). BACK
46. Reviews of boreholes: Pollack and Chapman (1993); Pollack et al. (1998); Pollack and Huang (2000); Pollack and Smerdon (2004), for influence see, e.g., the 2001 IPCC report, IPCC (2001a), p. 132. Boreholes helped solidify my personal confidence that global warming was underway (I was familiar with the crucial deconvolution technique from my doctoral thesis work). Review of tropical ice: Thompson et al. (1993), see also Thompson et al. (1995) and Krajick (2002). BACK
47. Oerlemans (2005) reviews long-term retreat to 1990. For subsequent retreat see IPCC (2007b), pp. 358-59, drawn from Kaser et al. (2006). On Kilimanjaro see this note in essay on public opinion. BACK
47a. The Medieval Warm Period and Little Ice Age were popularized by Brooks (1922) and Lamb, e.g., Lamb (1995), whose data and attention inevitably focused on the North Atlantic region. See Grove (1988). BACK
47b. Mann et al. (1998); Mann et al. (1999). BACK
48. For the history see Mann (2012), Monastersky
(2006), Pearce (2010), 13ff and ch. 8, and Bradley (2011). The first serious attack published in a peer-reviewed, albeit
obscure, journal (Climate Research) was Soon
and Baliunas (2003). Asked to respond, Mann and other top climate
experts gave strong reasons for regarding the criticism as groundless,
indeed based on grossly improper statistical methods, Mann
et al. (2003). The chief editor of Climate Research and
four other editors resigned, saying the peer-review process had been
faulty, see Monastersky (2003). McIntyre and McKitrick (2003) in another obscure journal claimed to have been unable to replicate the results from the data; this was comprehensively refuted by Wahl and Ammann (2007). The sloping
dashed line in the figure, indicating slight cooling over the past millennium,
did rely on data that were sparse and difficult to analyze. See Mann
et al. (2004), Jones and Mann (2004).
The possibility of abrupt shifts concealed
in the uncertainty band was pointed out by von
Storch et al. (2004), but their conclusion that the graph was faulty
overall was refuted by Wahl et al. (2006).
The likelihood that the smoothing process concealed large temperature
shifts was asserted by Moberg et al. (2005),
disputed by Mann et al. (2005). Returning to the fray, McIntyre
and McKitrick (2005) found a technical statistical error but it was too minor to affect the main conclusions, as shown by Wahl et al. (2006), and was corrected in Mann et al. (2007); see also Huybers (2005). For lucid explanations of this and other controversies use the search function on the professionally-run blog realclimate.org.
Jones and Mann (2004) argued that better data and
other lines of research confirmed, at a minimum, the unprecedented nature
of the modern rise. Mann et al. (2008) narrowed
the band of uncertainty with detailed reconstructions, finding a Northern
Hemisphere medieval warm period, but with post-1980s temperatures clearly
higher even if they excluded data from tree rings (the main point where
critics had attacked). See also note 48a, below.
"Past climate variations": Keith
Briffa quoted by Fred Pearce in New Scientist, Feb. 18, 2006,
p. 10. "Plausible": National Research Council
(2006). BACK
48a. A comprehensive survey is Mann et al. (2009). Volcanoes and Little Ice Age: Free and Robock (1999); Crowley (2000a); McGregor et al. (2015). Evidence that warm episodes were regional and "not strongly synchronous" was first assembled by Hughes and Diaz (1994). On the Medieval Climate Anomaly see for example Lund et al. (2006). "Coral data for the tropical Pacific... suggest a 'Medieval Cool Period'," according to Mann et al. (2006). An analysis of lake sediments and other proxies in the Arctic found something closely resembling the original hockey stick, with "four of the five warmest decades of our 2000-year-long reconstruction occurring between 1950 and 2000," Kaufman et al. (2009). BACK
48b.Ahmed et al. (2013) (the "PAGES 2k" team); Marcott et al. (2013); more recent confirmations: Neukom et al. (2019); PAGES 2k Consortium (2019). Uncertain: Bader et al. (2020), Bova et al. (2021), review: Kaufman and Broadman (2023)..BACK49a. The Berkeley Earth study had trouble with peer review and published in a brand-new journal: Rohde et al. (2012). Zombie arguments: see e.g., Stefan Rahmstorf, "Science Denial Is Still an Issue Ahead of COP28," RealClimate.org (Nov. 29, 2023), online here. BACK
49b.Senate Hearing: Dec. 28, 2015. Chris Mooney, "Ted Cruz keeps saying that satellites don't show global warming. Here's the problem," Washington Post, Jan. 29, 2016, online here. Problems: Mears and Wentz (2016); Mears and Wentz (2017); Swanson (2017); see Gavin Schmidt, "Comparing Models to the Satellite Datasets," Realclimate.org (May 7, 2016) online here. Stratosphere: BACK
49c. Lyman et al (2006); Willis et al. (2007). BACK
49d. Manabe & Wetherald (1967); In calculating the cooling, Tett et al. (1996) had to take into account not only the rise of CO2 but also the depletion of ozone, another greenhouse gas; thus, for example, the IPCC 2001 report noted stratospheric cooling and attributed it to human emissions, but as much the emissions that destroyed ozone as those from burning fossil fuels, IPCC (2001a), pp. 711, 714. For later developments see Maycock et al. (2018); by the early 2020s it was "virtually impossible for natural causes to explain satellite-measured trends in the thermal structure of the Earth's atmosphere,"Santer et al. (2023). The highlands of Bolivia and Tibet are above the levels where most of the greenhouse effect heat capture occurs. BACK
50. Schneider and Thompson (1981), quote p. 3145. Bryan et al. (1988) found that in Antarctica, “there is no warming at the sea surface, and even a slight cooling over the 50-year duration of the experiment.” due to an increase of mixing of deeper waters in Circumpolar Ocean. This was further confirmed with a much better model, Manabe et al. (1991). Current observations of Antarctic sea ice cover etc. are in accord with current models: IPCC (2007b), pp. 616-17, see also Zhang (2007) for sea ice. For the history see Manabe and Stouffer (2007), pp. 386, 401. Bolin (2007) p. 158 remarks on the lag in temperature and policy. On temperature lag see this note in the essay on General Circulation Models. BACK
50a. Lean and Rind (2009); Foster and Rahmstorf (2011). Aerosols: Solomon et al. (2011). Volcanoes: Santer et al. (2014). Arctic: Cowtan and Way (2013). BACK
50b. Ocean warming: von Schuckmann et al. (2009); Abraham et al. (2013); Nieves et al. (2015); "acceleration of the warming trend:" Balmaseda et al. (2013). Cheng et al. (2019); on ocean measurements ca. 2000-2018 see Gavin Schmidt, "The Long Story of Constraining Ocean Heat Content," Realclimate.org (Nov. 21, 2018), online here. Easterling and Wehner (2009) showed that "the climate over the 21st century can and likely will produce periods of a decade or two where the globally averaged surface air temperature shows no trend or even slight cooling in the presence of longer-term warming." Analysis: Statistical analysis: Rajaratnam et al. (2015); Lewandowsky et al. (2015). Santer et al. (2017) later showed that to fully explain the difference between temperatures measured by satellites and the rise that computer models had projected it was necessary to include external influences not expected by the models — more volcanoes and pollution, less solar activity. Meanwhile a minor but well-publicized revision of ocean temperature data by Karl et al. (2015) removed any statistical sign of a hiatus in one of the surface temperature series (NOAA's), prompting accusations of fraud from climate change deniers. BACK
51. "Hot topic:"Findlay and Wake (2021). Meehl et al. (2011) pioneered understanding of the heat storage mechanism, see discussion by Xie (2016); Kosaka and Xie (2013), Meehl et al. (2013), Tollefson (2014, England et al. (2014), Chen and Tung (2014); quote: Matthew England, University of New South Wales press release, 10 Feb. 2014, online here. BACK
52. IPCC (2001a), p. 6. The 2007 report saw even more evidence that it was "highly likely" that human activity was the main cause of warming. IPCC (2007b), TS.4. On the temperature record match with computer models see Richardson et al. (2016); Haustein and Otto (2019). Radiation imbalance: Loeb et al. (2021), Loeb et al. (2024), Mauritsen et al. (2025) , see also Goessling et al. (2025). "Wave of consternation:" Brady Dennis and Scott Dance, "It's Not Just Hot. Climate Anomalies Are Emerging Around the Globe," Washington Post, July 31, 2023, online here. Much faster: around 0.35°C, Foster and Rahmstorf (2026). BACK
copyright © 2003-2026 Spencer Weart & American Institute of Physics