On our watery planet the climate is governed largely by the oceans. But for a long time, discussions of climate change did not take the oceans fully into account, simply because very little was known about them. It seemed that the tremendous masses of water could vary only over a geological timescale. Ideas began to change at the start of the 1960s. Studies of clay extracted from the seabed, supported by new theoretical ideas, suggested that ocean current patterns might shift within mere thousands of years. Other studies began to build a picture of the complex and surprisingly fragile circulation of the world-ocean. In the 1980s, evidence from Greenland ice cores, supported by crude computer models, showed that the North Atlantic circulation could come to a halt within the space of a century or two if not faster. Fears arose that global warming might trigger such a shutdown, which would wreak serious harm. Observations after 2000 found that the circulation did appear to be slowing, and experts could not be sure that an abrupt halt was impossible. What was certain was that the oceans were rapidly warming, exactly as predicted by the greenhouse gas theory. Indeed most of the heat added to the planet was being sequestered in seawater, along with much of the carbon dioxide that humanity emitted. If changes in climate slowed these processes, the world would heat up even faster. (For sea-level rise, see the essay on Ice Sheets and Rising Seas.)
| Once scientists asked the question — and it was not an obvious question — the answer was plain. Where are the most important ingredients of climate? Not in the Earth's tenuous atmosphere, but in the oceans. The top few meters alone store as much heat energy as the entire atmosphere, and the oceans average 3.7 kilometers deep. Most of the world's water is there too, of course, and even most of the gases, dissolved in the water. The ocean waters, like the air, are in constant motion. The atmosphere has a pattern of winds, a general circulation that operates to move heat energy from the tropics toward the poles. Physics also drives the oceans to move heat polewards, carrying much more energy than the winds but much more slowly. | - LINKS - |
| It was during the 19th century that the significance of these simple facts for weather and climate became clear. The first thing scientists recognized was how winds passing over the oceans could bring moisture and heat to neighboring lands. Those who sought explanations for climate change included sea changes in their long list of possible causes, and some made this the linchpin. For example, in 1897 a geologist speculated that a deviation of the Gulf Stream current, due perhaps to a gradual raising of land, might set off a glacial epoch by interrupting the current's transport of heat to the Arctic.(1*) | Full discussion in |
| Currents like the Gulf Stream were only minor actors in the story. A far grander feature of the Earth’s surface heat circulation was recognized in the 19th century when scientists figured out why water hauled up from the deeps, anywhere in the world, is nearly freezing. (The phenomenon, discovered by a science-minded slave ship captain in 1751, became common knowledge when ships in the tropics chilled bottles of wine by lowering them overboard on a long rope.) The cold water must have sunk in Arctic regions and slowly flowed equatorwards along the bottom. It was a reasonable idea, since water would be expected to sink where the winds made it colder and thus denser. | |
| On the other hand, the warm tropical seas would evaporate moisture, which would eventually come down as rain and snow farther north; this would leave the equatorial waters more salty and therefore denser. So wouldn't ocean waters sink in the tropics instead? The question became part of a long-running debate over what mainly drove ocean circulation: was it differences in density, whether due to cold or salt, or was it the steady push of winds? | |
| Around the turn of the century, the versatile American scientist T.C. Chamberlin took up the question as part of his general program of studying causes of climate variations. He estimated that "the battle between temperature and salinity is a close one... no profound change is necessary to turn the balance." Perhaps in earlier geological eras when the poles had been warmer, salty ocean waters had plunged in the tropics and come up near the poles. This reversal of the present circulation, he speculated, could have helped maintain the uniform global warmth seen during some eras in the distant past.(2) |
|
| Chamberlin and a student of his also drew attention to the crucial role of the ocean in regulating the composition of the atmosphere — as one example, there were "eighteen potential atmospheres of carbon dioxide in the ocean." They noted that a warmer ocean would tend to evaporate more of its carbon dioxide gas (CO2) and also water vapor into the air, whereas a colder ocean would tend to absorb both gases. These were gases that helped keep the Earth warm through the greenhouse effect. So it appeared that if the planet began to warm up or cool down, the oceans might accelerate the tendency by releasing or taking up the gases. Chamberlin and his student recognized, however, that it was no simple matter to calculate just how the oceans might absorb and emit CO2. It depended not only on temperature and concentration but on complex chains of chemical reactions.(3) |
|
| Eternal Seas (1900-1950) TOP OF PAGE | |
| Through the first half of the 20th century, scientists ignored the intractable chemical complexities, which hardly seemed worth trying to unravel. Most people assumed as a general principle that over the time-spans relevant to human civilization, natural systems automatically regulated the amount of water vapor and other gases in the atmosphere. In particular, if burning fossil fuels added more CO2, then as some of the gas dissolved in seawater it would modify the concentration of carbonic acid there, in just such a way that the oceans could absorb all the extra gas.(4) The view was fixed in a widely read statement by Alfred J. Lotka. Since the oceans hold many times as much CO2 as the atmosphere, he explained, it seemed obvious that they must eventually swallow up 95% of any new gas, regardless of the details of the chemistry. The argument was roughly correct in principle (there are about 50 carbon atoms dissolved in the oceans for every one in the atmosphere). But Lotka, in tune with the common assumption that a "balance of nature" kept everything stable, had failed to wonder whether the oceans' absorption could keep up with a really rapid production of CO2. Scientists of the time assumed without much thought that any change in the atmospheric concentration of any gas could happen only over a geological timescale, hundreds of thousands if not millions of years.(5) |
|
| The circulation of the oceans was likewise pictured as a placid equilibrium. One pioneer later called this the "underlying theology" of a perpetual steady state of circulation. That was what scientists observed, if only because measurements at sea were few and difficult. Oceanographers traced currents simply by throwing bottles into the ocean. It took them a century to work out the general pattern. "The first law of ocean research," a leader of the field recalled, "was to never waste your assets by occupying the same station twice! And when this law was violated and the results differed, the differences could be attributed to equipment malfunctioning." The inevitable consequence, he remarked, was "a climatology steady in time."(6) |
|
| The classic picture of steady-state circulation was laid out in Harald Sverdrup's definitive textbook of 1942, drawing on the pathbreaking expeditions of the German oceanographic vessel Meteor in the 1920s. Sverdrup described, as one item in a list of many ocean features, how cold, dense water sinks near Iceland and Greenland and flows southward in the deeps. To complete the North Atlantic cycle, warm water from the tropics drifts slowly northward near the surface. Winds presumably added a push to this heat-driven cycle, although the effect of trade winds and the like was entirely uncertain. Sverdrup did not remark that the immense volume of warm water drifting northward might be significant for climate. Like all oceanographers of his time, he gave most of his attention to rapid surface currents like the Gulf Stream.(7*) | |
| Through the 1950s, few scientists found much reason or opportunity to study the slow circulations in the depths. Oceanography was a poorly organized field of research. There were only a few oceanographic institutes, jealously isolated from one another, each dominated by one or a few forceful personalities. The funds for research at sea were wholly inadequate to the vast subject. The economics of shipping and fishing supported only studies of practical interest such as surface currents; little data had been gathered about anything else. The field as a whole scarcely looked like solid science. Theories about ocean circulation had what one expert called "a peculiarly dream-like quality."(8) | |
| Nobody could see a way to do much better. Samples pulled up from thousands of feet down had allowed oceanographers to label the main water masses by temperature and salt content. Thus they could see, among much else, that the water that sank near Iceland had made its way along the bottom as far as the South Pacific. Little more could be said. It seemed impossible to actually measure the motion of these enormous, sluggish slabs of water.(9) | |
| Oceanographers had not settled the old debate over how much of the general circulation was driven by the winds, and how much by density changes related to temperature and salinity. Those who attempted to build theoretical models of the circulation gave their greatest attention to the winds, so meaningful to all who went to sea. Besides, as one of them confessed, "the wind-driven models were easier to formulate."(10) Although the calculations were primitive, they gave a starting-point. Bit by bit, explanations were devised for important features of the ocean circulation. In particular, in the mid 1950s Henry Stommel threw light on some puzzling old observations by calculating the way cold, salty water could sink in only a few small northern regions of the North Atlantic and creep along the bottom of the oceans, rising as far distant as the Pacific and returning by various routes.(11) | |
| Change in the Oceans (1950s-1960s) TOP OF PAGE | |
| The 1950s gave oceanography, like many other fields of geophysics, a breakthrough in organization and funding because of two developments connected with the Cold War. First came the creation of the U.S. Navy's Office of Naval Research, which naturally took great interest in anything that might bear on the Navy's confrontation with the Soviet Union. The ONR liberally dispensed money for all sorts of research projects, imposing some coordination on the isolated research institutions. Second was the International Geophysical Year (IGY) of 1957-58, where scientists hoped to turn geopolitical rivalry into peaceful channels. IGY funding further expanded and strengthened ocean research under the leadership of an international committee. Oceanography was a central player in the IGY, for here as in no other field it was undeniable that progress depended on genuine cooperation among nations, setting aside their political rivalries. Aside from the advantages of having many ships on the seas doing coordinated studies at the same time, even a single survey vessel would be hamstrung without access to foreign ports. |
|
| A surge of new observations aroused the sleepy field of oceanography. For example, probes of the deep North Atlantic produced real numbers for the way the Gulf Stream's northward current was balanced by a massive southward drift far below. "The long-established notion of nearly stagnant ocean depths is now doubtful," Time magazine reported in 1959.(12) | |
| From the outset, the scientists who planned the IGY believed that the role of the oceans in climate change was something they should gather data on, if only for the benefit of future researchers. The point was explained magisterially by the influential meteorologist Carl-Gustav Rossby. Considering how temperature was balanced against salt density, he thought it "not unlikely" that the oceanic circulation "must undergo strong and probably rather irregular, slow fluctuations." Thus over the course of a few centuries vast amounts of heat might be buried in the oceans or emerge, perhaps greatly affecting the planet's climate. In sum, putting climate change and oceanography together would generate important questions and fine opportunities for research. Combining these disparate fields would not be easy, however, and not only because it posed a severe intellectual challenge. Oceanographers and meteorologists worked in separate communities; it would take them decades to establish regular communication and cooperation.(13) |
|
| The first impressive result of the combined approach was published by a meteorologist, Jerome Namias, in 1963. The previous winter had been phenomenally cold and snowy in North America and Europe. Namias argued plausibly that this was caused, paradoxically, by some unusually warm surface water lingering in a region of the North Pacific. By now oceanographers were taking enough measurements at sea to detect such anomalies, and meteorologists were getting a feel for how a patch of warm seawater might change wind patterns across the entire hemisphere. The patch itself had apparently been maintained by an unusual wind pattern that pushed tropical surface waters northward. It was a persuasive example of what Namias called "complexly coupled mechanisms" leading to a "self-perpetuating system." A change in prevailing winds changed the ocean surface temperature, which in turn influenced the prevailing winds, shifting the planet’s weather system at least for a while.(14*) | |
| Namias's work attracted no special notice at the time. It was just one of a number of studies that led to the recognition, in the 1970s, that there were ocean-atmosphere feedback oscillations on a timescale of a few years to a few decades. Most important was the "El Niño-Southern Oscillation" (ENSO) in the tropical Pacific. For centuries Peruvian fishermen had recognized big variations in their annual catch, which turned out to be connected to irregular changes in the upwelling of cold water off the coast. The scientific breakthrough came in 1969 when Jacob Bjerknes presented a persuasive hypothesis for interactions between what had long been known as separate phenomena: the "El Niño" surface temperature changes in the South Pacific Ocean, and the "Southern Oscillation" of pressure changes in the atmosphere above it.(14a) Bjerknes's study attracted intense interest once scientists recognized that the El Niño events were connected with powerful if temporary climate anomalies around the world, from torrential rains in Peru to droughts in Kansas. |
|
| Another set of observations meanwhile cast into doubt the old assumption that the world-ocean maintained an unvarying circulation over many thousands of years. In the mid 1950s, oceanographers managed to drill into the floor of the deep sea, extracting long cores of ooze and clay sediment. Analysis of fossil shells in the cores told much about the condition of the seawater when the sediments had been laid down. Although interpretation of the data was tricky, it seemed to say that the temperature could make a giant jump in as little as a thousand years. Wallace (Wally) Broecker, a young geochemist who had been studying climate changes recorded in ancient lake levels and comparing them with ocean data, began to ask whether "the present configuration is a transient one." Could it change abruptly with serious consequences for climate? Broecker saw no way to tell whether that could really happen, or ever had. The available data on ocean waters could be interpreted well enough using the traditional model of a torpid, steady-state circulation.(15) |
|
| A supplementary essay describes how scientists got Temperatures from Fossil Shells, a good example of the ingenious oceanographic techniques and the controversies they could engender. | |
| Broecker was well aware of a bold theory about how ocean changes could turn ice ages on and off rapidly. In 1956 two of his senior colleagues, Maurice Ewing and William Donn, had suggested that raising or lowering sea level could do the trick by letting warm water from the Atlantic spill into the Arctic Ocean or shutting it off. They were drawing on the old tradition of hand-waving ideas about how climate might change in response to the opening or closing of straits, which acted like "valves" controlling the ocean currents that warmed or cooled a region.(16) This tradition had imagined a gradual geological process, with currents responding passively. But now a few people were ready to speculate, if not in scientific articles then in comments to colleagues, about a more sensitive ocean system. |
|
| In 1957 Columbus Iselin, director of the Woods Hole Oceanographic Institution, shared with a journalist some of the talk in the air at Woods Hole. It seemed possible, he said, that during warmer past epochs the North Atlantic water had not been cold enough to sink, so the oceans had stopped overturning. That might happen in future if a greenhouse effect caused by humanity's emissions of CO2 warmed the planet past some critical point. At that point the ocean waters would not so readily absorb CO2 and carry it into the depths. Thus the level of the gas would climb and greenhouse effect warming would accelerate. It was hard to predict the outcome. If the Arctic Ocean became warm enough to lose its cover of ice, so much moisture might evaporate and come down as snow that it would trigger the formation of continental ice sheets. "Are we making a tropical epoch...," Iselin wondered, or "starting another ice age?"(17) | |
| Henry Stommel explored the idea of a radical shift more analytically. He sketched a simple model of the oceans as tanks connected by pipes, with circulation driven by differences of density due to both temperature and salinity. Working through the equations turned up critical points. At these points a small change in conditions, even a temporary perturbation, could provoke a "jump" between states. The system, Stommel noted demurely, "is inherently fraught with possibilities for speculation about climatic change."(18) Broecker took up the challenge, speculating that "the Earth has two stable modes of operation of the ocean-atmosphere system, glacial and interglacial." | Link from below <=>Simple models |
| That would explain a puzzle that came up in the mid 1960s from studies of deep-sea cores. It seemed that slight variations in the planet’s orbit had somehow set the timing for major glacial periods. The orbital variations made only minor changes in the sunlight falling at a given point; something had to be amplifying the effect. Ocean circulation was a leading suspect.(19) At a conference held in Boulder, Colorado in 1965, where climate specialists put together for the first time a variety of evidence and ideas about how the climate system could lurch into a new state, speculations about modes of ocean circulation came to the fore. |
|
| A particularly stimulating idea came from Peter Weyl of Oregon State University in the mid 1960s. He noticed that the moist trade winds that cross the Isthmus of Panama and drop rain into the Pacific Ocean carry fresh water out of the Atlantic, leaving behind saltier water. Weyl built on this to develop a theory of the ice ages, involving the way changes of saltiness might affect the formation of sea ice. He did not publish his model until 1968, but he presented the rudiments at the 1965 Boulder conference. The theory would scarcely have been noticed among the many other speculative and idiosyncratic models for climate change, except for a novel insight. |
|
| Weyl pointed out that if the North Atlantic around Iceland should become less salty — as might happen, for instance, if melting ice sheets diluted the upper ocean layer with fresh water — the entire circulation could lurch to a halt. Without the vast drift of tropical waters northward, he suggested, a new glacial period could begin. Others since Chamberlin had speculated that the circulation might stop if global warming somehow made northern surface waters less dense. Now explicit calculations, however crude, made the idea seem worth studying. Just how precariously balanced was the circulation — which was coming to be called the "thermohaline circulation" (from the Greek for heat and salt)? And how important was it for climate anyway?(19a*) (See above) | |
| The circulation of the world-ocean was better charted now, thanks to the advent of nuclear weapons and reactors. Since the 1950s important practical concerns had augmented the purely scientific curiosity of oceanographers. Government officials hoped to bury radioactive waste from nuclear reactors in the abyss. Meanwhile fallout from bomb tests was already mixing into the Pacific Ocean, sparking an international outcry and demands to know exactly where the poisons were going. All these demands to study ocean circulation were fulfilled with a new technique which also came from nuclear physics. The radioactive isotope carbon-14 could now be measured in the CO2 dissolved in a volume of seawater. Pull up a canister filled with water from the depths, and the isotope would tell you how many years had passed since that water had been on the surface, absorbing the gas from the atmosphere. Several groups took up the challenge. They were financed by agencies that oceanographers of the 1930s never dreamed of, ranging from the International Geophysical Year to the U.S. Atomic Energy Commission. |
|
| In the lead was a group at Columbia University's Lamont Geological Observatory, established by Maurice ("Doc") Ewing in 1947. Isolated amid woods overlooking the Hudson River outside New York City, Lamont scientists were combining geological interests with oceanography and the new radioactive and geochemical techniques in a burst of creative research. The intense interaction between oceanography and radiochemistry might seem surprising, except that government agencies concerned about fallout from nuclear weapons tests took an interest; some nine-tenths of Lamont's funding in its first quarter century derived from military contracts. Not all the scientists were well aware of this strong military connection, which was veiled in secrecy, and many pursued their research with little attention to anything beyond the purely scientific implications.(20) Yet the Lamont group was never far from Cold War concerns as they painstakingly measured carbon isotopes in more than a hundred samples drawn from waters around the world. |
|
| When the group began this work in 1955, nobody could say whether the oceans took a hundred years to turn over or several thousand, nor just what paths the circulation followed. The pattern of flow turned out to be different from what Sverdrup had supposed. Tracking down the ages of various water masses showed that water was moving northward across the surface of the Atlantic all the way up from Antarctica. The return flow of cold water underneath went all the way into the middle of the Pacific. Equally significant was the time scale, which turned out to be half a millennium or so (in particular, the deep water of the North Atlantic had been down there an average of 650 years).(21) Other groups using carbon-14 data agreed that on average the ocean waters took at least several hundred years to turn over. Would that suffice to bury greenhouse gases as fast as humankind produced them? The question prompted Roger Revelle at the Scripps Institution of Oceanography in California to take a close look at the chemistry of CO2 dissolved in seawater. He showed that the uptake was slow: it would take many hundreds of years for the oceans to dispose of the extra gas we added to the atmosphere. |
|
| The full story of the crucial discovery that the oceans cannot rapidly absorb CO2 is given in a supplementary essay on Revelle's Discovery | |
| Mapping and Modeling the Circulation
(1970s) TOP OF PAGE |
|
| As the 1970s began, the idea of large shifts in the ocean-atmosphere system, only hinted at in cores of deep-sea clay, began to get support from studies of ice cores drilled from the Greenland ice cap. That helped stimulate yet more models for the causes of the ice ages. For example, in 1974 Reginald Newell suggested how oceanic ice sheets could help create "the two preferred modes" for the global movement of heat. When sea ice spread widely (say, around Antarctica) it insulated the sea from the frigid air. The water would no longer get cold enough to sink, and the ocean circulation would decrease. As Newell admitted, all this was guesswork and needed much more study, including numerical modeling.(23) |
|
| By this point scientists recognized that they would never understand climate change at all until they knew how the oceans worked. "We may find that the ocean plays a more important role than the atmosphere in climatic change," a panel of experts remarked in 1975. They said that should be "a major motivation for the accelerated development of numerical models for the oceanic general circulation."(24) In computer models of climate, oceans were rudimentary compared with the model atmospheres. When climate models of the 1960s calculated the general circulation of the atmosphere, in place of oceans they put a "swamp" — a mere motionless wet surface. Yet ocean currents were surely a main component of the climate system. In 1969, the leading modeler Syukuro Manabe used crude measurements by oceanographers to estimate that the currents carried roughly as much heat from the tropics to the Arctic as the general circulation of the atmosphere carried. It seemed that something like half the motor of climate was simply absent from the atmosphere models.(25) (In later decades, better data would show this to be an exaggeration, but it is true that energy transfers through the oceans are a crucial part of the climate system.) | |
| Two obstacles kept modelers from handling the oceans in the same way as the atmosphere. First, while meteorologists measured the atmosphere daily in thousands of places, oceanographers had only a scattering of occasional data for the oceans. And second, while atmospheric models could bypass many difficulties by using a simple equation or a single number to stand in for a complex process like a storm, ocean models could not use that trick. For in the seas, analogous processes lasted months or decades, and had to be computed in full detail. Even the fastest computers of the 1970s lacked the capacity to calculate central features of the movements of energy in the ocean system. They could not even handle something as fundamental and apparently simple as the vertical transport of heat from one layer to the next. | |
| Direct observation showed that heat from the atmosphere was absorbed rather quickly by the turbulent upper few dozen meters of seawater (the "mixed layer"), but below that the heat penetrated much more slowly into the cold bulk of the oceans. With the warmer water sitting on top, there was little convection and each layer was mostly isolated from the rest. That bare information was enough for some simple models of climate developed in the early 1970s. Modelers pointed out that if anything added heat to the atmosphere, such as the increase of CO2 and other greenhouse gases, much of the heat would be absorbed into the upper layer of the oceans. While that was warming up, the world’s perception of climate change would be delayed for a few decades. The first generation of atmospheric general circulation models had entirely ignored that, treating the oceans as simply a wet surface in equilibrium. "We may not be given a warning until the CO2 loading is such that an appreciable climate change is inevitable," a panel of experts explained in 1979. "The equilibrium warming will eventually occur; it will merely have been postponed."(26) (Decades later, vastly more powerful computers that could track a program of reducing emissions over the course of decades found the temperature rise would level off at about the time emissions reached zero. The panel's point remained valid — by the time serious heating became so obvious that people agreed to act, more emissions and thus more heating would be unavoidable. The dangerous lag was not in the oceans, but in our political and economic systems.) |
<=>Modern temp's |
| A senior oceanographer confessed that scientists had no understanding of the physical processes that brought heat into the depths, but only "a set of recipes." And even the recipes "may be completely wrong."(27) Another big unknown was the interaction between currents like the Gulf Stream and the giant eddies that the currents spun off as they meandered. Evidence of these broad, sluggishly rotating columns of water had turned up during a survey voyage across the North Atlantic in 1960. This was confirmed by an international campaign carried out by six ships and two aircraft in the early 1970s — another example of how studying ocean phenomena needed international cooperation. The survey discovered eddies bigger than Belgium that plowed through the seas for months. What oceanographers had supposed were static differences in the oceans between their sparse measuring-points had often actually been changes over time, not over space. | |
| The oceanographers had been vaguely aware that when meteorologists built atmospheric models, they included the energy carried by wind eddies as an important factor (physical oceanography, as one practitioner remarked, was "to some extent a mirror of meteorology"). Yet it was astounding to see what prodigious quantities of heat, salt, and kinetic energy the ocean eddies transported. Indeed most of the energy in the ocean system was in these middle-sized movements, not in the ocean currents at all.(28*) | |
| Water is not like air, and computers that could handle meteorological computations were far too slow to work through comparable models for this swirling ocean "weather." As one expert complained in 1974, "Extensive research efforts have not yet yielded much more than a greater appreciation of the difficulty of these questions."(29) To get a handle on the problem, oceanographers had to understand the oceans from top to bottom. But they had little data on the depths — the occasional expeditions, retrieving bottles of water here and there from kilometers down, were like a few blind men trying to map a vast prairie. Oceanographers liked to remark that we had better maps of the face of the Moon than of the deep sea. After all, there was little economic incentive, nor much military interest either, in studying the colossal slow movements of water, salts, and heat through the abyss. |
|
| The decades-long variations as currents and giant eddies sloshed about in ocean basins were on a scale too great not only for computers, but for human lives. A significant ocean change took longer than producing a typical doctoral thesis, sometimes longer than an entire career. "This is bad for morale," as one oceanographer remarked wryly, and an intellectual obstacle besides. How long would it have taken meteorologists to develop ways to predict weather, if they saw only a handful of storms and cold fronts pass through in a lifetime?(30) | |
| Stommel worried that oceanographers did not even know how to start attacking the problem of ocean and climate changes with their current supply of ideas, techniques, and funds. He felt that researchers were spending their time on "tractable side problems... skirting problems of the ocean circulation" as too tough to handle. The only way forward, he said, would be a concerted group effort.(31) But it would not be easy to persuade people that this would be worth their time and money. "Thinking about the climate is a relatively new business for oceanographers," a science journalist reported in 1974, "and despite pressure from their meteorological colleagues many believe that global monitoring and modeling of the oceans... is simply beyond the present capacity of the field."(32) | |
| The scientists who made such complaints meant to spur action, and action did get underway. The U.S. government and a few other governments began to give oceanography more money and attention. Already in 1968 the Glomar Challenger had put to sea to begin a Deep Sea Drilling Project. Technologies for working on the ocean floor at great depths had been developed extensively for commercial purposes such as oil prospecting, and for Cold War missions including top-secret searches for sunken submarines and lost nuclear weapons. Now these technologies were put to use for scientific oceanography, including some work related to climate. In particular, increasingly accurate methods had been devised to analyze fossil shells as a "thermometer" for past temperatures. The technique was put to use in the "CLIMAP" project, which in 1976 produced maps of sea temperatures at the peak of the last ice age, roughly 20,000 years ago. As expected, the oceans had looked quite different then — cooler overall, and probably with "a more energetic circulation system."(33) But other studies, using different markers, found hints that North Atlantic waters had sunk less readily during the last ice age.(34) A number of features were hard to explain, a challenge for every attempt to model oceans. |
|
| Another major project that the U.S. government funded in the 1970s was GEOSECS (Geochemical Ocean Sections Study), which studied the present ocean circulation. Teams of researchers sampled seawater at many points, and not only for natural carbon-14. Nuclear bomb tests in the late 1950s had spewed radioactive carbon, tritium, and other debris into the atmosphere. The fallout had landed on the surface of the oceans around the world and was gradually being carried into the depths. Thanks to its radioactivity, even the most minute traces could be detected. The bomb fallout "tracers" gave enough information to map accurately, for the first time, all the main features of ocean circulation. "Now that we have the GEOSECS data," Broecker boasted, "what more can be said on this subject?"(35) |
|
| The improved grasp of ocean circulation came just in time for a problem that was especially troubling oceanographers: exactly how much CO2 were the oceans currently absorbing? The GEOSECS data helped them win a long debate with other scientists over the global balance of carbon, taking into account gases emitted by burning fossil fuels and the destruction of forests.(36) Yet questions remained about just how the masses of water moved about. Only full-scale computer modeling could give answers, using the GEOSECS data as a reality check. Broecker admitted that "At least a decade will pass before a realistic ocean model can be developed."(37) |
|
| Attempts to represent ocean circulation on computers had begun in the late 1960s. In the lead was Kirk Bryan, a Woods Hole oceanographer who had picked up computer modeling from the enthusiasts at the Massachusetts Institute of Technology while working there for a Ph.D. in meteorology. Joseph Smagorinsky’s atmosphere modeling group in Princeton, funded by the U.S. Weather Bureau, recruited Bryan to add an oceanographic dimension. Ocean modeling posed so many challenges, known and unknown, that many experts thought it was "a fool's mission," and in any case something the Weather Bureau had no business funding. But Harry Wexler, the Bureau's savvy research director, turned a blind eye and the effort got underway. | |
| Bryan and a collaborator, Michael Cox, laboriously worked up a numerical model for an ocean basin — highly simplified of course, but with five levels. Their computer produced a map of numbers that did look roughly like the Atlantic Ocean's Gulf Stream and equatorial flow. Bryan later recalled that it was not easy to get such work published. For modeling "was looked at with deep suspicion by many of the oceanographic colleagues as... premature." Most oceanographers were still struggling to map out what was actually in the oceans, and to understand basic processes like the giant eddies that computers were nowhere near able to calculate.(38) | |
| Nevertheless Bryan pushed ahead, motivated, as he put it, by "the pressing need for a more quantitative understanding of climate." One example of the tricks he devised was to revise the equations so they did not include vertical movements of the water surface — the mathematical equivalent of clamping a rigid lid on the oceans. Bryan was pretending that the most obvious feature of oceans, their surging waves, did not exist. That scarcely mattered for the slow circulation, and it speeded up computations tremendously. One major influence remained to account for. Winds helped drive the ocean currents that moved heat from the tropics polewards, and the movement of heat in turn was a main influence on climate. So in 1969 Bryan coupled his ocean basin model to Syukuro Manabe's model of atmospheric circulation. The pair got a recognizable simulation of a slice of climate (if not exactly our own planet's climate), and signs of a thermohaline ocean circulation.(39) |
|
| Others now gravitated toward ocean modeling. A research program that had once seemed "a lonely frontier like a camp of the Lewis and Clark Expedition," as an ocean modeler recalled in 1975, took on "more of the character of a Colorado gold camp." One reason was breathtaking advances in computer power. Equally important was the extraordinary improvement in oceanographic data, thanks to GEOSECS and other large-scale ocean surveys. These gave for the first time a three-dimensional picture of the actual oceans in motion — a target the modelers could aim at. They constructed plausible models for individual basins like the North Atlantic and Indian Ocean. It was Bryan's work that "established the paradigm," as another expert later remarked. In contrast to the wide variety of approaches in atmospheric models, most ocean modelers created "varietal forms" based on similar physical assumptions and numerical methods.(40) | |
| Now that highly simplified systems had established that the thing could work, modelers forged ahead with more realistic geography. First to plausibly model the entire global ocean was Bryan's collaborator Cox, using nine levels of ocean and a grid with boxes measuring two degrees of latitude by two of longitude. The calculations used up so much computer time that he could only follow the ocean circulation a few years in its centuries-long progress, but overall the simulated ocean moved somewhat like the real one. Coupling this to a model global atmosphere gave results that had "some of the basic features of the actual climate," as Manabe and Bryan quietly boasted. Many unrealistic features remained. Modelers had a long way to go before they could calculate ocean circulation well enough to furnish accurate models of climate.(41*) |
|
| Unpleasant Surprises? (1980s) TOP OF PAGE | |
| Computers could scarcely model changes in the oceans accurately without good data on how things had changed in the past. An important handle on the problem was provided by the Deep Sea Drilling Project (1963-1983), followed in 1985 by an international Ocean Drilling Program using the American JOIDES Resolution, converted from an oil-drilling ship. In expeditions across the seven seas, year after year workers pulled up thick cylinders of clay and ooze, totaling many kilometers. The wet cores were preserved in "libraries" which any scientist could exploit for climate studies alongside many other topics. |
|
| Fossils of shells that had drifted down from the surface to rest in the mud told a story of the ocean waters in the past, with a striking conclusion. It now seemed beyond doubt that there had been shifts in the North Atlantic, particularly around the end of the last ice age some 11,000 years ago — a time geologists on land had long known as the "Younger Dryas" climate shift. The entire pattern of ocean circulation had evidently changed within a couple of thousand years, or perhaps only a few hundred.(42*) | |
| That resonated with studies by Willi Dansgaard, Hans Oeschger, and others using cores drilled out of the Greenland ice sheet in the early 1980s. Certain periods such as the Younger Dryas had seen very abrupt warming followed by slower but severe cooling around the North Atlantic, episodes so striking that they got a name of their own, the "Dansgaard-Oeschger events." Meanwhile a study of changes in the minuscule fossils of deep-sea species showed that the cooling had extended clear to the ocean floor. Such studies using microbiology were not given much credence at the time, however. A bit more convincing was a 1983 report, using the geochemistry of isotopes in the fossils, with complex evidence pointing to "a dramatic change in ocean circulation" in the last glacial period. The deep waters of the North Atlantic had apparently grown cold and still. Scientists were being gradually pushed to think about major transitions in the circulation of the North Atlantic, or even the entire world-ocean.(43*) |
|
| Oeschger was particularly struck by a jump in the atmospheric concentration of CO2 at the end of the last ice age, which others had recently discovered in ice and deep-sea cores. The vexing problem of how the gas got in and out of the atmosphere had intrigued him ever since 1958, when he had worked with Revelle's group at Scripps just as they were discovering that greenhouse warming was plausible. Oeschger also understood that a feedback that released more and more of the gas might accelerate the end of an ice age. | <=CO2 greenhouse |
| The main reservoir of CO2 was the oceans, so that was the first place to think about. In 1982 Broecker visited Oeschger's group in Bern, Switzerland, and explained current ideas about the North Atlantic thermohaline circulation. Broecker also shared an intriguing new idea: the ocean's uptake of CO2 during an ice age depended on biochemical changes involving the growth and death of plankton. Oeschger reflected that Broecker's biochemical mechanism would take thousands of years to operate, too slow for the rapid changes found in ice cores. Perhaps, he thought, there had been a transition in the ocean from "a relatively stagnant state" to a state where more rapid mixing brought nutrients to the surface and thus changed the biochemistry. |
|
| The stagnant state might have been caused (as Weyl had earlier speculated) by fresh water flowing in when the continental ice sheets melted. That would have diluted the surface salt water until it would not sink, halting the circulation. Many questions remained, Oeschger conceded. But major circulation changes might well have been involved — perhaps triggered by some little perturbation.(44) | |
| Oeschger worried that eventually a switch between ocean circulation modes might be set off by the greenhouse gases that humanity was adding to the atmosphere. But as a colleague recalled, "his early warnings were often greeted with disbelief." Oeschger tried to find collaborators to write a paper on circulation modes for submission to a top scientific journal like Nature or Science, but he met only skepticism and gave up the effort. Two colleagues at Bern did publish a paper in Nature suggesting that "ocean circulation changes were the essential cause" of the rapid CO2 variations seen in ice cores, giving Oeschger credit for the idea, but like Broecker they concentrated on biochemical changes rather than the circulation as such. Oeschger continued to bring the idea up at scientific meetings. Broecker heard him, and his interest was aroused.(45) | |
| As we have seen, Broecker had been thinking for decades about possible ocean instabilities. (See above) The reports of big, rapid CO2 variations in Greenland ice cores stimulated him to put this interest into conjunction with his oceanographic interests, since nothing but a major change in the oceans could cause such a swift and global shift in the atmosphere. | |
| Scientists later realized that the rapid variations seen in the ice cores had been misinterpreted. They did not reflect changes in atmospheric CO2, but only changes in the ice's acidity due to dust layers. Something had indeed changed swiftly — not the CO2 level, but the dustiness of the entire Northern Hemisphere, as a change in weather patterns swept more minerals from deserts. No matter: the error had served a good purpose, pushing Broecker to a novel and momentous calculation. Broecker recalled that one day as he sat in Bern, listening to a lecture by Oeschger describing the abrupt variations in ice core data, "an idea hit my brain.... As quick as that, my studies in oceanography and paleoclimatology merged."(46) | |
| In 1985, Broecker and two colleagues published a paper in Nature titled, "Does the Ocean-atmosphere System Have More than One Stable Mode of Operation?" Crediting Oeschger as the first to suggest that the apparent CO2 changes in Greenland ice cores represented a jump between "two modes of ocean-atmosphere-biosphere-cryosphere operation," the paper continued that "it is tempting to speculate" that Oeschger's two modes corresponded to different states of the North Atlantic thermohaline circulation. | |
| Broecker and his collaborators now identified the key. It was what he later described as a "great conveyor belt" of seawater carrying heat northward. Although the GEOSECS survey of radioactive tracers had laid out the gross properties of the circulation a decade earlier, it was only now, as Broecker and others worked through the numbers in enough detail to make crude computational models, that they fully grasped what was happening. They saw that the vast mass of water that gradually creeps northward near the surface of the Atlantic carries much more heat than the familiar and visible Gulf Stream. "It was an easy calculation," recalled Broecker, "and I was astounded by the amount of heat that it had." The energy carried to the neighborhood of Iceland was "staggering," Broecker explained — nearly a third as much as the Sun sheds upon the entire North Atlantic. If something shut down the thermohaline conveyor belt, climate would surely change across much of the Northern Hemisphere.(47*) |
|
| In one sense this was no discovery, but only an extension of an idea that could be traced back to Chamberlin at the start of the century. (See above) Few scientific "discoveries" are wholly new ideas. An idea becomes a discovery when it begins to look real. Broecker made that happen by providing solid numbers and plausible mechanisms. Chamberlin had speculated that the circulation could shut down if the North Atlantic surface water became less salty. Now the effect had been calculated. And Broecker pointed out geological evidence that it might actually have happened, at the start of Younger Dryas times. Just then a vast lake dammed up behind the melting North American ice sheet had suddenly drained, releasing a colossal surge of fresh water into the ocean. | |
| Broecker's impressive idea was typical of many ideas in geophysics for the way it drew upon several different areas of data and theory. His own career (as may be seen elsewhere in these essays) had rambled through a variety of fields. Ever since the days when he had trudged around fossil lake basins in Nevada for his doctoral thesis, Broecker had been interested in sudden climate shifts. The idea had remained in his mind while he studied the Atlantic Ocean's circulation as revealed by radioactive tracers, the geo-biochemistry of surface seawater as reflected in deep-sea cores, the timing of sea level changes as measured in coral reefs in New Guinea, and numerous other seemingly unrelated topics. "It's like doing a picture puzzle," he remarked. "You get stuck on one, and then it just sits there. And then along comes an idea, and you say, 'Oh my God, that's a piece that fits right there.' " The trick was to keep many pieces on the table, which meant keeping several different lines of research going at the same time. When one piece fitted into another an unexpected picture could appear, like the possibility of a sudden shutdown of the North Atlantic conveyor belt. Within the next few years Broecker expanded his vision. The North Atlantic thermohaline circulation, he pointed out, was only one segment of a much larger exchange of water, salt, and heat, extending through the Southern Ocean clear to the North Pacific — a global conveyor belt, possibly fragile on a global scale.(48*) | |
| The paper by Broecker and his collaborators made a stir among scientists, less for its new ideas than for putting forth in a plausible and dramatic way hypotheses that until then had been hazy and unappreciated. "Until now," the authors wrote, "our thinking about past and future climate changes has been dominated by the assumption that the response to any gradual forcing will be smooth." Even the most elaborate computer models of climate had shown only gradual transitions — but by their very structure that was all they could be expected to show. In the real world, when you push on something it may remain in place for a while, then move with a jerk. |
|
| The numerical ocean models of the 1980s were inadequate to explore such a jerk. The fastest computers could still scarcely handle the immense number of calculations that even a quite simple model required. Modelers normally began with a static ocean and ran it through a few simulated decades (or if they could get enough computer time, a century or so) of "spin-up" to watch the currents establish themselves. The models did not get through even a single complete cycle of the globe-spanning circulation. As a real-world check, scientists also needed to get a much closer look at the details of the fossil climate record. "Unless we intensify research in these areas," Broecker warned, "the major impacts of CO2 will occur before we are prepared fully to deal with them."(49) | |
| In 1987, Broecker followed up with an even more provocative Nature paper titled, "Unpleasant surprises in the greenhouse?" Here he emphasized the risk that the current buildup of greenhouse gases might set off a catastrophe. "We play Russian roulette with climate," he exclaimed. He issued the same warning in testimony to Congressional committees, in discussions with journalists and in a magazine article.(50) |
|
| A few scientists and the science journalists who listened to them began to warn that the ocean circulation might shut down without much warning, making temperatures plunge drastically all around the North Atlantic. London and Berlin are in the same latitude as Labrador, they pointed out, and would be as barren if not for the prevailing winds that pick up heat from the ocean and carry it eastward. Only the more attentive members of the public heard the warning at this time (later, in the early 2000s, it would become notorious as a science-fiction scenario). |
|
| "Does the ocean-atmosphere system have more than one stable mode of operation?" Broecker's question was already on the mind of computer modelers concerned with future climate change. Even before Broecker published his ideas, Kirk Bryan and others had been working up numerical simulations that included changes in ocean salinity as well as wind patterns. What they found was troubling. A 1985 study suggested that if the level of atmospheric CO2 jumped fourfold, the oceans' global thermohaline circulation could cease altogether.(51) Another study found that even small perturbations could give rise to radically different modes of ocean circulation. In particular, a spurt of fresh water suddenly released from a melting continental ice sheet — the kind of event that some thought might have triggered the Younger Dryas — could switch the circulation pattern in as little as a century.(52*) |
|
| These studies were no more than suggestive, for the models of the mid 1980s were still extremely limited. The planet might be represented in the computer as, to take one example, three equal continents and three equal oceans, extending from pole to pole like the segments of a grapefruit, with the oceans all of uniform depth and the continents without mountains. To keep computation time within reason, Bryan had to hold the cloudiness constant, although he knew clouds would interact with climate change in crucial feedbacks. Along with all that, as Bryan remarked, "uncertainties abound concerning the interaction of the ocean circulation and the carbon cycle."(53) | |
| Most groups still had too little computer power, and too little understanding, to manage full-scale models of both ocean and atmospheric circulation, let alone link them together. They continued to treat the oceans as a passive "swamp" that exchanged moisture with the air but did little else. That forced the model atmosphere to handle all the transport of heat from the tropics into the polar regions, whereas in the real world ocean currents do a good share of the work. And it entirely missed how heat might sink into the ocean deeps. The few teams who attempted ocean circulation models had to use highly schematic geography, and they often left out regions near the poles, which brought mathematical troubles where the longitude lines converged to a point(54) |
|
| In 1988 Syukuro Manabe and Ron Stouffer published a coupled atmosphere-ocean model with more realistic geography. As they were varying the CO2 to see how that might change climate, they made an inadvertent discovery. If they started two computer runs with the same CO2 level and other overall physical parameters (the "boundary conditions"), but with different random "initial conditions" for the first day's weather, they could wind up with two radically different but stable states. In one state, the thermohaline circulation was operating. In the other, it wasn't. The model was still packed with unrealistic simplifications. Yet it seemed at least an "intriguing possibility," as they put it, that global warming might shut down the North Atlantic circulation within the next century or so, with grave implications for regional climates.(55) | |
| Signs of Fragility (Late 1980s-Early 2000s) TOP OF PAGE | |
| In 1989 two groups separately succeeded in coupling a general circulation model of the oceans to a general circulation model of the atmosphere that had realistic geography covering the entire planet. One of the groups also included a crude model of sea ice. Such coupled ocean-atmosphere computer models improved rapidly through the 1990s, and gradually took a central role in thinking about climate change.(56) Confidence in the validity of models increased as some managed to reproduce the striking El Niño oscillations. Still more encouraging, computer specialists could now reproduce not only the current state of the atmosphere and oceans but also, using the same models without artificial adjustments, the radically different climate that had prevailed at the height of the last ice age. |
|
| Despite these triumphs, much remained to be done before anyone could form a clear picture of how the oceans connected to long-term climate change. Perhaps the most vexing of the many difficulties was figuring in the large amount of CO2 that the ocean's plankton absorbed from the atmosphere. The plankton population depended on the sea surface temperature, and still more on nutrients brought in by rivers, by wind-borne dust, and by the upwelling of ocean currents — all of which could change as climate changed. The plankton's biochemical behavior meanwhile would affect the chemical balance of seawater, which was also crucial for CO2 uptake or release. |
|
| Alongside these intricate indirect effects, scientists gradually learned to worry about a problem that stemmed directly from the rise of atmospheric CO2. As ever more of the gas dissolved in the oceans, the acidity of the surface water was measurably increasing. This would make it harder for the water to continue to absorb gas (by the buffering mechanism Revelle had reported back in 1957). Also, the acid might eventually dissolve the calcium-carbonate shells of plankton, corals, and other creatures important in marine food chains, with uncertain effects on seawater chemistry — not to mention fisheries. Scientists would have to untangle these complexities before they could truly understand how the oceans' uptake of CO2 would influence the future climate. |
|
| Plenty of surprises were still coming from new data. Especially striking were studies in the 1980s that turned up layers of tiny pebbles in North Atlantic deep-sea cores. The debris could have traveled across thousands of kilometers of ocean in only one way: rafted within far-traveling icebergs. Apparently the North American ice sheet had disintegrated at the edges — perhaps in a gigantic surge? — so that great numbers of icebergs had broken off and sailed the Atlantic as far as Spain. This fitted with speculations about the breakup of Arctic Ocean ice that had been circulating for decades. In 1988 a German graduate student, Hartmut Heinrich, published evidence that the "iceberg armadas" had swarmed across the North Atlantic roughly every 10,000 years. That attracted little attention. It seemed like just one more manifestation of the slow glacial cycles regulated by periodic variations in the planet's orbit.(57) |
|
| In 1992 Gerard Bond, working with Heinrich, Broecker, and others, showed that the timing of these "Heinrich events" was not in fact consistent with the orbital periodicities. Moreover, some of the Heinrich events had coincided with the more frequent abrupt events during the last glacial epoch that Dansgaard and Oeschger had seen in a Greenland ice core, at intervals of roughly a couple of thousand years. Some experts had dismissed these glitches in the ice data as merely random weather anomalies at the drill's particular location. But a second ice core, drilled hundreds of kilometers away, reproduced the variations so precisely that the Dansgaard-Oeschger fluctuations "could no longer be in doubt." |
|
| A research team centered on Broecker at Lamont (now named the Lamont-Doherty Geological Observatory) found the Heinrich debris layers held evidence of sharp drops in sea-surface temperature, and drops in salinity too. As the great iceberg armadas melted, had they dumped enough fresh water into the North Atlantic to keep the seawater from sinking, shutting down the entire thermohaline circulation? Broecker suggested that in 1994, pointing to evidence that some Heinrich events had coincided with lurches of climate in other places all around the globe | |
| The exact sequence of cause and effect was obscure. The best guess was that a Heinrich event began when the colossal ice sheet weighing on eastern Canada surged all on its own. In any case, it now seemed plausible that large-scale climate shifts, connected with transitions in ocean circulation, could affect the entire North Atlantic region. Broecker's claim that icebergs from Canada could change climates around the world was harder to swallow. As one scientist remarked, many of his colleagues "do not believe that the small, energy-starved polar 'tail' can wag the large, energy-rich tropical 'dog'."(58*) | |
| Whatever had set off the abrupt shifts, they were seen in glacial eras, not the present warmer times (although some of the shifts, called "Bond events," had taken place during the millennia as the climate was warming up). "Could this happen in the absence of greatly extended ice cover?" Broecker asked. "There is surely a possibility," he replied, "that the ongoing buildup of greenhouse gases might trigger yet another of these ocean reorganizations." If the circulation did stop, he warned, the changes in weather could bring "widespread starvation" within decades. News media picked up the idea, peddling a dramatic image of countries around the Atlantic returning to the ice-age conditions of the Younger Dryas. |
|
| The segment of the global thermohaline circulation that moved through the North Atlantic — what was coming to be named the Atlantic Meridional Overturning Circulation (AMOC) — attracted increasing scientific attention. The Intergovernmental Panel on Climate Change (IPCC), an international panel of experts appointed by governments to make a best guess about future climates, looked into the question at length. In 2001 they reported a consensus that a shutdown of the AMOC in the coming century was "unlikely" but "cannot be ruled out."(59) | |
| Was the circulation already slowing down? In the next few years, scientists reported that North Atlantic waters were indeed growing less salty, thanks to fresh water from increased rainfall and the melting of Greenland ice. Also troubling was a 2005 announcement that the amount of heat carried southward by the Atlantic circulation had decreased by as much as 30% since the 1950s. However, experts pointed out that all this might be just part of a normal decades-long cycle that had nothing to do with global warming. Later surveys found that the system did vary widely from year to year, so it might take decades of observations to confirm any definite trend. The circulation was not really a smoothly running "conveyor belt" of water, heat and salt; it operated in fits and starts, swayed by the whims of giant eddies and surface winds.(60*) | |
| Nevertheless, magazines, newspapers, television science shows and even a major Hollywood thriller had popularized the notion that a sudden "shutdown of the Gulf Stream" could plunge the entire Northern Hemisphere into an ice age almost overnight. Experts in related fields began to pay attention, and pointed out that nothing so sudden and drastic was possible. For one thing, the planet-spanning thermohaline circulation was not the same thing as the Gulf Stream. That famous surface current was an inevitable result of prevailing winds on a rotating planet, and nothing would shut it down. Another thing that seemed obvious in retrospect, but was not widely recognized until 2002, was that if the broader North Atlantic circulation slowed down,that would not make England's climate as cold as Labrador's. For Labrador lies downwind from tundra that is frozen in winter, whereas England is warmed by prevailing Westerly winds that pick up the ocean's heat, much of which is simply heat retained from the summer. A slowdown of the circulation would never be a sudden science-fiction cataclysm. In any case, present-day conditions could not replay the specific scenario of the Younger Dryas with its disintegrating Canadian ice cap. |
|
| On the other hand, it was true that any big change in the AMOC might bring damaging changes in weather around the North Atlantic and to a lesser degree around the world. Broecker was not the only expert who worried about still worse danger lurking amid the forces that drove the circulation, forces still poorly understood and changing as the planet warmed.(61*) | |
| It was up to computer modelers to evaluate the danger, but they had yet to fully grasp the global circulation. Coupled ocean-atmosphere models posed a severe challenge even for the new supercomputers, whose grid boxes in the early 2000s were too large to realistically represent narrow currents like the Gulf Stream. Modelers could not directly compute such crucial features as the giant ocean eddies, but had to represent them with a simple set of average parameters. Nevertheless the modelers managed to simulate abrupt shifts of the North Atlantic circulation, confirming that during a glacial period it could shut off and on. Since the 1990s some studies had also found the global circulation changing in the future warmer world — but always as a gradual, centuries-long shift.(62) |
|
| In the best tradition of scientific self-correction, Broecker admitted that he had overestimated the danger of a sudden AMOC shutdown. In 2004 he publicly cautioned against"exaggerated scenarios" as in the recent Hollywood summer spectacle. By 2008 experts generally agreed that the Atlantic circulation was very unlikely to collapse in the 21st century, and not likely to collapse later — "although," some admitted, "the possibility cannot be entirely excluded."(63) | |
| After all, as Broecker pointed out, the computer models were built to give stable solutions. One pair of modelers admitted this frankly: "Anecdotal evidence suggests that many modeling groups (including our own) have encountered problems with an unstable AMOC, to the extent that it collapsed in their present-day model climate. These problems are seen as a model deficiency that in most cases would not be published but repaired by changes to the model..." The models, in short, might be artificially and unrealistically ignoring abrupt change. | |
| The worry was reinforced by the fact that modelers could not simulate the unquestionably rapid Younger Dryas shifts without artificial interventions. More generally, observed long-term climate variations could be much greater than anything seen in conventional computer simulations. Presumably modelers had not correctly incorporated all the complex feedbacks and forces, known or unknown. As one group that studied the Younger Dryas warned, "understanding of past abrupt climate changes is only preliminary. This does not bode well for predicting future, abrupt climate changes."(64) | |
| In 2006 a new ice core from Antarctica cleared up some of the confusion by turning an old assumption upside-down. Researchers had located a place on the ice sheet where snow accumulated so rapidly that the core displayed what was happening century by century. For the first time, changes in Antarctic and Greenland temperatures could be matched in detail. As some scientists had suspected, the periodic events turned out to be not a uniform global warming or cooling; they followed a "seesaw" that redistributed heat from one hemisphere to the other. When the circulation changed so that the North got cooler, the South got warmer, and vice versa — totally unlike the current warming all around the globe. Later work showed that the Younger Dryas, in particular, had involved a shift of circulation that warmed the Southern Hemisphere while cooling the Northern one. That resolved an old puzzle: the Younger Dryas was indeed a global event, but with different consequences in different places.(65*) |
<=>Rapid change
|
| This new understanding was part of a larger transition in oceanography. Since the 1990s the field's long-standing focus on the North Atlantic region (where many of the pioneers had lived) had been giving way to a broader global perspective. Oceanographers were coming to believe that the Southern Hemisphere, the Pacific Ocean, and tropical seas in particular could easily be as important as the North Atlantic in any circulation change. For one thing, it was becoming plain that ordinary El Niño events in the tropical Pacific seriously affected weather right around the world; if future El Niños grew weaker or stronger (as seemed to have happened in past millennia) it would make a global difference. | |
| Already in 1995 a pair of researchers had confronted the concern about the sinking of cold water in the North Atlantic. They showed that prevailing winds at the opposite ends of the globe drove upwelling of water from the deeps. As long as the winds blew, some kind of circulation would persist. "The fact that winds in the southern hemisphere might influence the formation of deep water in the North Atlantic," they remarked, "brings into question long-standing notions about the forces that drive the ocean's thermohaline circulation."(66) | |
| Meanwhile data extracted from tropical ice caps and sea-floor shells showed that equatorial waters had undergone major changes during the ice ages. Past generations of climatologists had believed that the ice ages had scarcely affected tropical seas and jungles. This was now replaced by a view of the planet as a system where every region reacted to changes everywhere else. Consider, to take just one obscure mechanism, Weyl's old idea about the winds that carried moisture across Panama from the Atlantic to the Pacific, altering the salinity on both sides. In 1990 Broecker and co-workers speculated that a shift of tropical climate that changed the winds could drive a feedback cycle that might bring "massive and abrupt reorganizations of the ocean-atmosphere system." There were probably other mechanisms operating in less-studied parts of the world, adding their own complexities.(67) |
<=>Rapid change |
| Progress in understanding ocean changes would always depend on hard data, and oceanographers had sampled only a minute fraction of the world-ocean. Beginning in the 1970s, collaborative projects mobilized thousands of people from scores of nations. A march of acronyms started under the international Global Atmospheric Research Program (GARP) with regional studies like the groundbreaking GARP Atlantic Tropical Experiment (GATE), carried out in 1974. Next came a Tropical Ocean-Global Atmosphere study (TOGA) that surveyed the equatorial Pacific, inspired by the devastating El Niño of 1982-83. To feed the computer models, there were now satellites (starting with the short-lived SEASAT of 1978) that could measure winds, waves, temperatures, and currents in the remotest reaches of the seas. But the satellites could not measure everything, and what their instruments did measure required "ground truth" observations for checking and calibration. The global approach was embodied in a World Ocean Circulation Experiment (WOCE), planned in the 1980s and carried out in the 1990s by some thirty nations. It was supplemented by a Joint Global Ocean Flux Study (JGOFS), concluded in 2003, that looked at CO2 uptake and other ocean chemistry.(68) |
|
| New Complexities, Persistent Risks (2000- ) TOP OF PAGE | |
| As greenhouse gases rise, Earth does not radiate all the energy that it receives from the Sun back out into space; the imbalance results inevitably in heating. Roughly nine-tenths of the excess energy goes into heating seawater, which takes up energy more readily than the air, ice, or land. If Earth had no oceans, its temperature would be soaring much faster. Some of the energy added to the ocean surface water migrates into lower and colder layers, significantly slowing the rise of surface temperature and the overall rate of global warming. One of the difficulties in calculating how rapidly the planet as a whole might heat up was uncertainty about how the heat energy taken up by surface waters is sequestered in the deeps. | |
| The global thermohaline circulation and events like the El Niño upwellings move water up or down only in some regions, and slowly, accounting for only a fraction of the surface heat loss. At first oceanographers assumed that most of the heat in the top layer was transported into lower layers all across the oceans through some kind of average convection. As a crude expedient, computer modelers simply threw in a constant parameter that matched the average global data for heat transfer. Direct observations, however, cast doubt on that picture. The top water in most ocean regions forms a stable warm layer that barely mixed with the colder water below. Why wasn't the surface heating up more rapidly (and the whole planet with it)? Oceanographers began searching for mechanisms that could transport heat downward. | |
| They found an odd but probably important mechanism in the internal waves on the interface between ocean layers: the waves could break, mixing water between the layers. Still more effective, it appeared, were the tides. Tidal mixing of coastal waters might be as important as saltiness and winds in driving the global circulation, which depended as much on the "pull" of water returning to the surface, especially in the Southern Ocean around Antarctica, as on the "push" of water sinking in the North Atlantic.(69) | |
| Around 2006 some scientists published a still stranger idea, which experiments confirmed a dozen years later. It seemed that one significant way the ocean layers were mixed was through the churning of countless tiny swimming animals that proliferated in the upper ocean layers of some regions. If climate changes affected these marine populations, the biological response could have profound effects on the overall circulation. The upper ocean layers also seemed to mix together more in regions with many storms, and storminess was another thing that might change as the climate changed. Yet another mechanism for transferring heat, suggested in 2016 and later confirmed by observations, occurred not at the top of the oceans but the bottom. Where currents near the sea floor met a ridge or seamount, they bent upwards in bursts of turbulence. | |
| The emerging understanding of how the oceans were stirred by tides, by deep currents flowing over a rough sea floor, by storm winds, and even by plankton, gave computer modelers much to explore, even if additional mechanisms didn't turn up. It was a beginning — although only a beginning — in calculating just how and where heat moved up and down through the layers. Adding to the urgency of the question, observations showed that over the past half-century the stratification of the oceans had increased (a natural result of the steady addition of heat to the surface). As the upper layers continued to warm up, it might become more difficult for the heat to make its way downward.(70*) | |
| If it was important to find how the oceans slowed global warming by removing heat from the atmosphere, it was still more important to understand how they removed CO2. Rough calculations showed that the oceans were sequestering roughly a quarter of the gas humanity was emitting (land plants took up another quarter, and the rest was accumulating in the atmosphere). Without ocean uptake, the atmospheric level would have been rising 50% faster, and global heating would have already become catastrophic. Simple calculations showed that the physical mixing of layers that carried away heat was far too slow to dilute the surface waters significantly on a timescale of decades — yet somehow the surface was not becoming too acidic to take in more CO2. In the 1980s oceanographers showed that we are rescued by a "biological carbon pump." The surface layers are a rich broth of plankton, and their minuscule carcasses and feces drift down like snow, carrying gigatons of carbon into the abyss. Later studies discovered an even more important transport of carbon in the vast daily migration of sea creatures. Swimming up at dawn in countless numbers to feed, at dusk they descend hundreds of meters to hide—and deposit carbon. |
|
| The oceans held many other surprises and uncertainties. For example, there was evidence that the North Atlantic Ocean, all on its own, went through quasi-regular oscillations. This tended to confirm the cycles of around 60-80 years that Dansgaard and others had reported in the region. Since the 1920s, meteorologists had been talking about a decades-long cycle of weather patterns around the North Atlantic, later named the Atlantic Multidecadal Oscillation (AMO). Studies of the variations in ancient tree rings suggested the oscillation had been going on irregularly for centuries. In 1964 Bjerknes had offered an explanation by bringing in ocean currents: the pattern could arise from an interaction between changes in atmospheric and oceanic circulation patterns. As computer models advanced, some of them showed just such a tendency to generate long-term oscillations; apparently cycles were a natural tendency of ocean basins. |
|
| These ideas were questioned by a 2012 study that found the North Atlantic variations observed since 1860 could largely be explained without invoking ocean currents at all. The chief driving force was wind and temperature patterns that rearranged under the influence of aerosols from volcanic eruptions along with pollution by humans. In 2021 Michael Mann, who two decades earlier had coined the term AMO, gallantly admitted that the cycle "doesn’t actually exist. It's an artifact... of the fact that volcanic forcing happens to have displayed a roughly multidecadal pacing in past centuries." Understanding how ocean basins operated was a difficult exercise. and always tentative. | |
| On the other hand, there was no doubt about the El Niño Southern Oscillation (ENSO), in which sea surface temperatures rose or fell sharply across a band of the tropical Pacific Ocean every few years. In the 1990s, studies of fisheries led to the discovery of another semi-regular cycle of warm and cool phases, changing on a longer timescale of two or three decades, the Pacific Decadal Oscillation (PDO). Like El Niños, the PDO turned out to have a significant influence on far distant weather patterns, Even the Arctic Ocean had some sort of decadal variation, which had long been noticed in atmospheric weather records (the Arctic Oscillation, AO). For researchers who wanted to understand changes in temperature in specific regions or even globally, the El Niños and other slow sloshings of water masses added a layer of difficulty.(71) |
|
| The irregular oscillations became newsworthy in the early 2000s. People who denied that global warming was a problem publicized a decade-long pause or "hiatus" in the rising curve of global atmospheric temperature. Had the warming stopped? No: amid the normal irregularities of climate the short-term deviations were not statistically significant. But scientists will try to explain every wiggle in a curve (whence the saying, "Your noise is my data"). The hiatus was easily explained as a temporary cooling phase of the equatorial Pacific following a surge of warming from an unusually strong El Niño. Nevertheless it took a decade of discussion and an undeniable resumption of soaring global temperature to make the deniers hold their tongues. |
|
| Meanwhile both the public and oceanographers continued to take a particular interest in the stability of the AMOC, the North Atlantic portion of the global thermohaline circulation. Was there a serious risk of the kind of shutdown that had happened in glacial times, or the still more catastrophic changes touted in science fiction? Computer teams attacked the problem with the latest models, and their findings were reassuring. A modest slowdown would not have serious effects on climates in the region, perhaps simply retarding global warming there. In 2007 the IPCC announced a consensus of experts that there would probably be a gradual change which might affect fisheries, but a rapid and dramatic shift of the ocean circulation was "very unlikely" within the 21st century.(72*) | |
| Not everyone had such confidence in computer models; oceanographers needed to see what was actually happening. The massive international observation programs of the 1990s, deploying ships and airplanes, were winding down, replaced by fleets of automatic instruments. Beginning in 2004 the U.S. National Science Foundation specifically targeted the AMOC by deploying an array of moored sensors across the mid Atlantic from Florida to the Canary Islands. By 2014 the instruments had accumulated enough data to report that the Atlantic circulation had slowed down, by perhaps 7% per year. | |
| Meanwhile, a new analysis of scraps of data going back to 1957 revealed a possible slowdown by 10% in the latter 20th century, while a study of sediments reported the circulation since the mid 19th century had been "anomalously weak" as compared with earlier millennia. And a team studying past temperatures reported evidence that "the AMOC weakness after 1975 is an unprecedented event in the past millennium." | |
| Most experts, however, were unwilling to draw firm conclusions amid the noise of water masses washing this way and that, still largely unobserved in many parts of the globe. It seemed physically implausible that the ponderous movements of these colossal masses could change significantly in less than a century. And swings of ocean currents were so common that scientists would need decades more of monitoring before they could say whether the recent North Atlantic slowing was a purely random fluctuation, or a phase of some natural cycle that would soon reverse... or something more ominous.(73) | |
| Every decade computers were more powerful while modelers incorporated ever more forces and feedbacks. Their models still diverged widely, but some were now able to calculate how iceberg armadas in the glacial era could have transformed the global circulation. And some models could turn up big ocean shifts even outside of glacial times, causing abrupt and severe climate change. In particular, a group that dove into details of the most advanced models reported in 2015 that quite rapid changes in ocean circulation might happen after less than 2°C of global warming. | |
| In the real world, a 2014 study of shells in seafloor sediments from the last interglacial period — the best geological analog to the present warm times — discovered century-scale interruptions in the North Atlantic circulation, connected with perturbations of polar ice. By 2020 oceanographers had managed to find unperturbed seabed sediments that allowed them to see ancient changes on a scale of mere decades rather than centuries. They were surprised to find big, chaotic changes during past epochs that were scarcely warmer than the present. "The ocean circulation system," a scientist warned, "may be much less stable than previously thought."(74) |
|
| Observations and models were beginning to converge. Around 2015 an unusually cold region appeared in the North Atlantic south of Greenland. This was a locale that oceanographers considered a crucial location for the sinking of cold water that drove the entire global circulation. The anomalous "cold blob" persisted in later years as the only part of the globe that was not warming. Just such an anomaly had already popped up in some computer models when a slowdown of the AMOC brought less heat to that region. Another sign that the northward flow of warm water was flagging was an increase in the salinity of the Southern Atlantic. |
|
| If the thermohaline circulation really was slowing, Hansen and others suggested that a main cause was the torrents of fresh water that were now flooding off the melting Greenland icecap — a feature of the warming climate that computer modelers had hitherto overlooked. Nor had they considered how Greenland's glaciers were disintegrating; as two scientists would remark a decade later, "The present-day Greenland Ice Sheet calving of icebergs is comparable to that of a mid-range Heinrich event." | |
| The "cold blob," along with intermittent pulses of freshwater from melting Arctic Ocean and Greenland ice, were shifting winds and currents around the North Atlantic in complex ways. That might be causing the severe heat waves and droughts that were afflicting Europe. Oceanographers could only speculate about the effects of all this on the AMOC itself. Some worried that the system might sooner or later pass a "critical threshold"—a point beyond which a shutdown could not be prevented even if the world stopped warming.(75) | |
| In the early 2020s studies drew attention to the other end of the globe. In some regions of the Southern Ocean trillions of tons of cold, briny surface waters plunged into the abyss, a vast unseen waterfall. This was a significant mechanism for sequestering carbon. It was also an important component of the global thermohaline circulation — which had turned out to be a complex system with interlocking branches rather than a single conveyor belt. A modeling team suggested that fresh water pouring from the melting ice of Antarctica could inhibit the sinking, and observations of the overturning in one region did find a spasmodic slowing in recent decades. It was another case of oceanographers, traditionally focused on the North Atlantic, realizing that the Southern Hemisphere was no less important.(76) | |
| Revisiting the question of the AMOC's stability in 2021, the IPCC experts now had only "medium confidence" that there would be no abrupt collapse before 2100. That was hardly reassuring, and confidence continued to drop. Two years later, an expert said the IPCC's evaluation was already "outdated." A study that combined modeling with ocean observations claimed to detect "fingerprints" showing that the AMOC could already be near a "critical transition point" for collapse. And a pair of researchers using unconventional statistical methods announced they had 95% confidence that "a transition of the AMOC is most likely to occur around 2025-2095." | |
| Further bad news came from a heroic six-month supercomputer run using the giant state-of-the-art Community Earth System Model. The team injected a prodigious torrent of Greenland freshwater into the North Atlantic; for the first time, a full-scale model showed the circulation slamming to a dead halt within the space of half a century or so. Worse, the model calculated that sea ice would then spread across the Atlantic as far south as Ireland every winter, and winds across the ice would freeze northern Europe catastrophically. The rest of the globe would also be affected (one group of experts even speculated about feedbacks that could raise sea level a meter or more within decades if the AMOC collapsed). Other experts, however, pointed out that the alarming scenarios relied on models that, like all climate models, were shot through with uncertain parameters and simplifications.(77) | |
| Another massive study was more reassuring. This team too introduced a monstrous flood of freshwater and looked at the consequences on no less than 34 leading models. The results pointed to "AMOC-stabilizing mechanisms." Overturning in the distant Pacific Ocean, and persistent winds in the Southern Ocean that drove upwelling there, provided a push that "sustains a weakened AMOC in all cases." Prodigious melting in Greenland might indeed slow the circulation, but a "collapse is unlikely this century." That left open the risk of a collapse in the next century. But just as people in the 1920s seldom thought of the 21st century, in the 2020s discussions of climate change, from everyday news accounts to graphs in IPCC reports, often stopped dead at 2100 | |
| Observations could not resolve the uncertainties. The arrays of sensors were certainly seeing changes in Atlantic Ocean currents, but it was still too soon to announce an undeniable transition in the system. A 2025 study that invented a new way to combine sea temperature data with models concluded bluntly that "an AMOC decline has not occurred yet." But whether or not the circulation really was slowing, most experts agreed that it was bound to weaken as global warming advanced. Was a complete and catastrophic failure of the AMOC a serious possibility, in this century or later? Nobody could say.(78). | |
| As usual, progress would depend on gathering more and better observations, and by now everyone knew this required surveying every corner of the world-ocean. A study of research papers published in 2000-2020 found that although "Atlantic research has dominated, Pacific research is nearing parity with its neighbour due to significant output growth by China." The most ambitious effort was an international "Argo" program that in 2004-2007 launched 3,000 robotic sensors all around the world. Each unit descended as deep as 2,000 meters (6,600 feet), measured temperature and salinity as it drifted on ocean currents, and returned to the surface every ten days to radio the data to passing satellites. "We've been blind about the oceans," an environmental scientist explained. "It's just been a dark room. And the Argo floats are like flipping on the lights." Among other important results, the program showed that the supposed "hiatus" in global warming in the early 21st century was an illusion: it didn't matter that the atmosphere was temporarily not warming, for the ocean depths, which absorbed far more heat energy, were warming steadily (and ever more rapidly). |
|
| Following up the Argo program, in 2009 the U.S. National Science Foundation (NSF) launched an Ocean Observatories Initiative, deploying instrumented buoys and robots that swam or glided in open-ocean and coastal areas. In 2014 an internationally funded study of "Overturning in the Subpolar North Atlantic" (OSNAP) set out a line of subsurface floats and other sensors stretching from Labrador to Scotland — the region where fresh water might force a halt. In 2020 the NSF added a Global Ocean Biogeochemistry Array, a network of robots that floated or dove to 2,000 meters, monitoring not only temperature and salinity but acidity, nitrates, and other variables of biological interest. Biology was also a main focus of the United Nations Decade of Ocean Science for Sustainable Development (UNDOS) that started up in 2021, coordinating thousands of individual research programs. Measurements of physical variables like circulation and salinity continued, while studies of marine ecosystems, motivated by their importance for sustaining human life, were also valuable for monitoring the crucial "biological carbon pump." As rising greenhouse gases damaged ecosystems, would sea creatures become less effective in sequestering carbon from the atmosphere? | |
| Oceanography could also be done in a laboratory — if the lab was big enough. For example, the Scripps Ocean Atmosphere Research Simulator that came online in California in 2022 was basically a large slice of ocean moved indoors. "Stretching 120 feet in this cavernous building," a journalist reported, "the 32,000-gallon concrete tank is topped with huge ducts that blast 60-mph winds across seawater piped in straight from the Pacific." The simulator's four-foot waves could reproduce conditions from the Caribbean to the Arctic Ocean. Without going to sea, experimenters could measure parameters crucial for climate models, such as the aerosols generated by wave action and the formation of sea ice.(79) | |
| Mining old data could also tell many things. Students and volunteers burrowed through historical records, such as handwritten logs of early whaling ships, to transcribe literally millions of numbers. One product was a database for the temperatures within the seas. Since the world-ocean absorbs dozens of times more heat than any other component of the climate system, it was here if anywhere that the reality of global warming should be visible. The team found that the heat content of the upper oceans had risen markedly in the second half of the 20th century, in a pattern that neatly matched the "signature" that computer modelers predicted from the greenhouse effect. This 2000 result was followed by a stampede of studies that by 2018 had determined not only that the upper levels of the oceans were warming but that the warming was, as the modelers expected, accelerating.(80) |
|
| The coupled ocean-atmosphere computer models were now fine-grained enough to produce beautifully detailed pictures of wriggling currents spinning off giant eddies. Adding ice, vegetation, and so forth, they could reproduce the main features of climate around the planet and how it had changed in the past. Modelers were now confident that they could calculate a general picture of what would happen in future decades as the level of greenhouse gases in the atmosphere climbed. The oceans would absorb only a fraction, probably a diminishing fraction, of the excess energy; the world would keep getting hotter. On the other hand, the models could not reliably calculate the size of an El Niño a year ahead, or the fate of the AMOC a half century ahead. Nobody could rule out the possibility of an extreme climate shock caused by a shutdown of the global ocean circulation, or perhaps by the pressure of global heating on processes not yet imagined in the convoluted systems that linked air, ice, seas, and living creatures. |
|
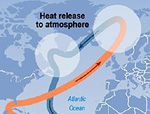
RELATED:
Home
Rapid Climate Change
General Circulation Models of the Atmosphere
| NOTES |
1. Hull (1897), noting that "the increased snowfall which would thus be caused... would tend to intensify the cold," p. 107; deflection of currents was likewise seen as central in the scheme of Croll (1875). BACK
2. Chamberlin (1906), quote p. 371; Fleming (1998), p. 89. BACK
3. Tolman (1899), quote p. 587. BACK
4. E.g., Gregory (1908), p. 348. BACK
5. Lotka (1924), pp. 222-24; for the state of thinking in the 1950s, see Hutchinson (1954), pp. 383-84. BACK
6. "theology": Munk (2000a), p. 45; similarly Wunsch (1981), p. 342; "first law": Munk (2000b), p. 1. BACK
7. Sverdrup et al. (1942), pp. 628-29, 635-37, 647, 685; Sverdrup (1957) likewise sees much more heat transport in the Gulf Stream than across the equator, and describes the North Atlantic deep circulation as driven by winds and heat but not salinity. BACK
8. Wenk (1972), pp. 38-41. H. Stommel, privately circulated document, 1954, titled, "Why do our ideas about the ocean circulation have such a peculiarly dream-like quality?" referenced in Warren and Wunsch (1981), p. 601. BACK
9. Deacon (1957), p. 81. BACK
10. Stommel (1987), p. 58. BACK
11. Mills (1998), p. 634; Warren and Wunsch (1981), pp. xvi-xvii, xxi, 12-13. BACK
12. Oreskes (2021) (especially for Stommel’s work); Wenk (1972), pp. 49-50; Miles (1981); Weir (2001). Time (1959), p. 52, q.v. for a survey of IGY oceanography. BACK
13. Rossby (1956); translated as Rossby (1959), p. 13. BACK
14. Namias's phrases here referred to how snow cover on land would add to the cold, but elsewhere he made a point of wind-sea feedbacks. Namias (1963), quotes pp. 6717, 6185; such a wind-ocean interaction was also reported by Bjerknes (1966). On Bjerknes see Fleming (2016). BACK
14a. Bjerknes (1969), see also Bjerknes (1966). BACK
15. Broecker (1957), p. III-12; Broecker et al. (1960a); Broecker et al. (1960b). BACK
16. Ewing and Donn (1956a); "valves" e.g., Humphreys (1940), pp. 623-24. BACK
17. Robert C. Cowen, "Are men changing the Earth's weather?" Christian Science Monitor, Dec. 4, 1957. Iselin did not mention, but was plainly referring to, the Ewing and Donn model. BACK
18. Stommel (1961), p. 228. BACK
19. Broecker (1966), p. 301. BACK
19a. Weyl (1968), speculating that the "temporary stagnation" of the bottom water would end because of warming by the interior heat of the Earth; the role of glacial meltwater suppressing North Atlantic Deep Water production was also pioneered by Worthington (1968); a neat explanation of the entire circulation in terms of water evaporating from the North Atlantic more than from the cooler North Pacific was indicated by Warren (1983). BACK
21. Broecker et al. (1960b); the circulation pattern was mentioned already by Rossby (1956); translated as Rossby (1959), p. 13. BACK
22. Note omitted.
24. GARP (1975), pp. 4, 219. BACK
25. Manabe and Bryan (1969); for empirical evidence they cite Sverdrup (1957). BACK
26. National Academy of Sciences (1979), p. 2. The thermal inertia of the oceans had been noted earlier, e.g., Sawyer (1972), p. 26, remarked that to come into equilibrium "would take of the order of 100 yr, and in consequence the oceans impose a substantial lag on the response of world temperature...". BACK
27. Munk (1966), "recipes" quote p. 728. This example of the struggle with vertical mixing includes a hypothesis about tidal effects; recipes for vertical diffusion may be wrong because mixing may actually happen only "in special places": Munk (1975) (at a 1972 conference). On warming leveling off see this note in the essay on General Circulation Models. BACK
28. Survey: J. Swallow and J. Crease on the British ship Aries. Campaign: the Mid-Ocean Dynamics Experiment (MODE) 1971-1973, promoted especially by H. Stommel. For history, see Wunsch (1981), 358-59, "mirror" p. 343. BACK
29. "extensive research": Schneider and Dickinson (1974), p. 465. BACK
30. Young (2000), p. 166. BACK
31. Stommel (1970), p. 1531. BACK
32. Hammond (1974), p. 1147. BACK
33. "Climate: Long Range Investigation, Mapping and Prediction." CLIMAP project members (A. McIntyre et al.) (1976), quote p. 1136; Cline and Hays (1976); the final product was maps (which I have not seen), CLIMAP (1981); note also CLIMAP (1984). The maps were for 18,000 carbon-14 years ago, now estimated at about 21,000 calendar years. BACK
34. Curry and Lohmann (1982); Boyle and Keigwin (1982). BACK
35. Broecker (1981), p. 449. BACK
36. A key model, including diffusion by eddies into the deeps: Oeschger et al. (1975); see also Broecker et al. (1979), q.v. for references to GEOSECS reports by H.G. Ostlund et al., University of Miami; Broecker et al. (1980). BACK
37. Broecker et al. (1980), quote p. 582. BACK
38. Bryan and Cox (1968). "Fool's mission:" Randall et al. (2018), p. 12.10. Wexler "agreed to look the other way:" Smagorinsky quoted in Lewis (2008), p. 1345.Bryan, interview by Weart, Dec. 1989, AIP. BACK
39. Manabe and Bryan (1969); Manabe (1969); Bryan (1969a), quote p. 806; "rigid lid": Bryan (1969b). BACK
40. Frontier: Reid et al. (1975), Introduction, p. 3; "paradigm... varietal" McWilliams (1996). BACK
41. Cox (1975) ("the most ambitious ocean simulation so far," according to W.L. Gates, p. 116); published at the same time was a somewhat cruder whole-ocean model, aimed at integration with the Mintz-Arakawa model, Takano (1975); Manabe et al. (1975), quote p. 3; together with Bryan et al. (1975); further landmarks included Manabe et al. (1979); Washington et al. (1980). BACK
42. Ruddiman and McIntyre (1981); Boyle and Keigwin (1982) (using Cd as tracer for nutrients); for further refs., see Broecker et al. (1985); later Boyle and Keigwin, using a core from a spot where deposits had built up exceptionally fast, found that "the deep ocean can undergo dramatic changes in its circulation regime" within 500 years, Boyle and Keigwin (1987), p. 36. BACK
43. "A basinwide change of deep water occurred," Schnitker (1979), quote p. 265; Schnitker (1982) speculated about unstable ocean feedback loops; "dramatic change": Shackleton et al. (1983), p. 242; Rooth (1982) wrote that "catastrophic transitions in the structure of the thermohaline circulation are not only possible, but have probably occurred on many occasions...," p. 131. BACK
44. "large-scale circulation changes," Oeschger et al. (1984), p. 303; they cited Broecker (1982b); for meltwater effect he cited Worthington (1968); and in more detail Ruddiman and McIntyre (1981); in 1990 Broecker cited Oeschger's paper as the first suggestion "that the Greenland events constitute jumps between two modes of operation of the climate system," Broecker et al. (1990). BACK
45. Oeschger to Broecker, 11/23/95 and reply 12/4/95, Broecker office files, Lamont-Doherty Geophysical Observatory, Palisades, NY. "Disbelief:" Stocker (1999); Siegenthaler and Wenk (1984). BACK
46. "Idea hit:" Broecker (2000), p. 13; Broecker also recalls seeing Oeschger at a 1984 Florida meeting. For further details of Oeschger and Broecker’s work see Broecker and Kunzig (2008), pp. 101-12. On this and faulty data: Broecker, interview by Weart, Nov. 1997, AIP. See also Broecker (2010), ch. 2. BACK
47. "Astounded": Broecker, interview by Weart, Nov. 1997, see also Dec. 1997, AIP. Broecker et al. (1985), "jumps... speculate," p. 25; "conveyor belt" and "staggering" heat flow were publicized in Broecker (1987b), p. 87, and laid out fully in Broecker (1991). Sverdrup (1942) thought most of the heat transport northward was in the atmosphere. One early crude estimate indicating considerable ocean heat transport was Oort and Vonder Haar (1976). Arnold Gordon of Lamont-Doherty published the first good description of the "conveyor" in 1986, but regarding heat transport he noted only that "The continuity or vigor of the warm water route is vulnerable to change" and would influence climate: Gordon (1986). For the history see also Manabe and Stouffer (2007). BACK
48. Broecker, interview by Weart, Dec. 21, 1997, AIP. Global conveyor belt: at first Broecker had a simple transport around the Cape of Good Hope to the Pacific, Broecker (1987), Fig. 2. Loops in the Indian Ocean appear in Broecker (1991); later work added, most notably, a Southern Ocean circulation all around Antarctica. BACK
49. Broecker et al. (1985), p. 25. BACK
50. Broecker (1987a), p. 123; Broecker (1987b); U.S. Senate, Subcommittee on Environmental Protection, Hearings, Jan. 26-28 1987, pp. 21-23. BACK
51. Bryan and Spelman (1985); the question is the title of Broecker et al. (1985). BACK
52. Bryan (1986). N.b. this is Frank Bryan, not Kirk. See Broecker et al. (1990). The cause of the event is still uncertain and under study. For full references see note 45 in "Rapid climate change". BACK
53. Bryan and Spelman (1985), p. 11,687. BACK
54. Schlesinger and Mitchell (1987), p. 796; McGuffie and Henderson-Sellers (1997), pp. 55-56; 1980s work is reviewed in Haidvogel and Bryan (1992); Meehl (1992). BACK
55. Manabe and Stouffer (1988), p. 841. BACK
56. Two groups: Washington and Meehl (1989) and Stouffer, Manabe and Bryan (1989); the latter included the sea-ice model by Bryan (1969). BACK
57. Heinrich (1988); earlier speculations: Mercer (1969); Ruddiman and McIntyre (1981). BACK
58. Bond et al. (1992), see also Broecker et al. (1992); no longer in doubt: Johnsen et al. (1992); Bond et al. (1993); Bond and Lotti (1995).MacAyeal (1993) proposed an influential theory of the North American ice sheet building up and surging at regular intervals.Around the globe: Broecker (1994). For historical details on Heinrich and Bond see Broecker (2010), ch. 5. Alley (1998). BACK
59. Alley (2000), ch. 15; Broecker et al. (1992); quotes: Broecker (1994), p. 424 and Broecker (1997), p. 1588; IPCC (2001a), p. 420. BACK
60. Lazier (1995); Bryden et al. (2005) (the editor of Nature removed a question mark at the end of the paper’s title, according to Petr Chylek, Letter, Physics Today, March 2007, p. 14). Kerr (2006d). Variations: reviewed by Lozier (2010). BACK
61. Seager et al. (2002). An important part of the explanation is that the direction of the winds over N. America and the Atlantic is pinned by the Rocky Mountains. For a more complete explanation, including Rossby waves and an argument that warmer oceans make for colder winters on land in N. America and Europe, see Kaspi and Schneider (2011) and Boos (2011). BACK
62. A key eddy parameterization: Gent and McWilliams (1990); for this history see Manabe and Stouffer (2007), p. 398-99. Manabe and Stouffer (1993) pioneered the demonstration of a transition under future warming; an improved model showed a shutdown was especially likely with rapid increase of greenhouse gas emissions, Stocker and Schnitter (1997); see also Broecker (1997); Wood et al. (1999); summary: Rahmstorf (1999); Ganopolski and Rahmstorf (2001) for instability during a glacial period; IPCC (2001a), pp. 439-40. BACK
63. "Exaggerated:" Broecker (2004); see Weaver and Hillaire-Marcel (2004); system variable: Cunningham et al. (2007) and Kanzow et al. (2007) . One study found temperature discrepancies from computer models up to "two orders of magnitude for tropical variability at millennial timescales," Laepple and Huybers (2014); "Unlikely... cannot be excluded," Clark (2008), p. 9. BACK
64. "Anecdotal evidence:" Hofmann and Rahmstorf (2009). Models unable: Liu et al.(2009); "does not bode well:" Lowell et al. (2005). BACK
65. The redistribution was suggested by Crowley (1992); Stocker (1998) and Broecker (1998) gave the "seesaw" term currency; Stocker and Johnsen (2003) gave a theoretical model. Antarctic results: EPICA community members (2006), see Jansen et al. (2007), p. 435. The "bipolar see-saw hypothesis" was further strengthened by well-dated evidence of past temperature changes in a core drilled in the South Atlantic, Barker et al. (2009). Younger Dryas: Barrows et al. (2007); Shakun & Carlson (2010; Broecker et al. (2010); see also Rasmussen et al. (2016). BACK
66. Toggweiler and Samuels (1995) Note also a suggestion that the "North Atlantic Oscillation" was driven by changes in upper atmosphere wind patterns around the entire hemisphere, Wallace and Thompson (2002). BACK
67. Broecker and Denton (1989), quote p. 2489; Broecker et al. (1990); for the evaporation cycle Warren (1983); a detailed review is Broecker and Denton (1990); for a more recent review, Broecker (2000). Also: the Agulhas current off the South African coast switched at the end of the ice age, perhaps playing a role as potent as the North Atlantic circulation, see summary in Zahn (2009). BACK
68. For a summary to 2001 see Thompson et al. (2001). Modeling under JGOFS continued to 2005. BACK
69. Munk and Wunsch (1998); Egbert and Ray (2000). The internal-waves hypothesis goes back to a "seminal" paper by W. H. Munk, Deep Sea Res. Oceanogr. Abstr. 13, 707-730 (1966), according to Ferrari (2014), cf. for a summary of history and current views. BACK
70. "Biomixing:"Dewar et al. (2006), Schiermeier (2007); experimental confirmation: Houghton et al. (2018) see Wilke (2022). Mapping global patterns and incorporating the results in models was described as "...a daunting task... requires a large effort, but ... feasible". For another important type of mixing, the breaking of the internal waves on the surfaces between layers of different densities, Gregg et al. (2003). Merryfield (2005) reviews mixing studies. For mixing by tropical storm winds, Sriver (2010). One additional mechanism, turbulence in currents like the Gulf Stream: Liao et al. (2022). On abyssal topography see Ferrari et al. (2016), Voosen (2022). Stratification increase (5-6% since 1960): Li et al. (2020). BACK
71. Bjerknes (1964), Schlesinger & Ramankutty (1994); Kerr (2000a); Booth et al. (2012), Clement et al. (2015), Voosen (2019b), Haustein and Otto (2019); Mann et al. (2021), "artifact:" M. Mann, "The Rise and Fall of the 'Atlantic Multidecadal Oscillation'," Realclimate.org, March 4, 2021, online here. For the PDO see Mantua and Hare (2002). BACK
72. A typical model showing a roughly 2°C drop in Europe was Vellinga and Wood (2002) . A later comparison of 11 coupled atmosphere-ocean models found the circulation "decreases by only 10 to 50% during a 140-year period (as atmospheric CO2 quadruples), and in no model is there a land cooling anywhere...," Gregory et al. (2005). "Very unlikely:" IPCC (2007c), p. 16. BACK
73. Slowdown: Smeed et al. (2014); see Schiermeier (2014). New analysis: Kanzow et al. (2010); "anomalously weak:" Thornalley et al. (2018). A slowdown after 1995 was reported by Mishonov et al. (2024). Unprecedented: Rahmstorf et al. (2015), see Caesar et al. (2021). Natural cycle: see Jackson et al. (2016), Latif et al.(2022). BACK
74. Iceberg armadas: Menviel et al. (2014), Henry et al. (2016). Changes in the ocean circulation “are able to produce abrupt climate changes on decadal to centennial time scales:” Randall et al. (2007), p. 641. Less than 2°C: Drijfhout et al. (2015). Last interglacial: Galaasen et al. (2014). "Much less stable:" Stocker (2020), commenting on Galaasen et al. (2020). BACK
75. "Cold blob" (or "warming hole"): Caesar et al. (2018). Salinity: Zhu and Liu (2020). Fresh water: Hansen et al. (2016); Liu et al. (2017). Chris Mooney, "Why Some Scientists Are Worried about a Surprisingly Cold 'Blob' in the North Atlantic Ocean," Washington Post (Sept. 24, 2015), online here. Comparable to Heinrich event: Zhou and McManus (2023. See also Drijfhout et al. (2015), Sgubin et al. (2017), Armstrong McKay et al. (2022). Freshwater pulses precede European heat waves: Oltmanns et al. (2024). "Critical threshold:" Oltmanns et al. (2018). BACK
76. Southern Ocean: Li et al. (2023), Gunn et al. (2023), see Russell (2023). BACK
77. "Medium confidence::" IPCC (2021b), p. 27, IPCC (2021a), Technical Summary Box TS.3. "Outdated:" Stefan Rahmstorf, "New Study Suggests the Atlantic Overturning Circulation AMOC 'Is on Tipping Course'," RealClimate.org (Feb. 9, 2024), online here. Critical transition point: Boers (2021); around 2025-2095: Ditlevsen and Ditlevsen (2023). A critique of tipping point calculations: Ben-Yami et al. (2024) . Six-month run: van Westen et al. (2024). Group of experts: Hansen et al. (2016), BACK
78. Unlikely this century: Baker et al. (2025). Fu et al. (2020), Koman et al. (2024); not occurred yet: Terhaar et al. (2025).See also examples of 2025 AMOC model studies in this note. BACK
79. Publications: Potter and Pearson (2023), "Dark room:" Stephen Pacala quoted in Doug Hamilton et al., "Decoding the Weather Machine," Nova/WGBH (2018). Matt Simon, "This Groundbreaking Simulator Generates a Huge Indoor Ocean," Wired.com, (Oct. 26, 2021), online here. BACK
80. Levitus et al. (2000), Levitus et al. (2001) (NOAA team); Barnett et al. (2001), updated and improved by Levitus et al. (2005). Later work: Cheng et al. (2019). BACK
copyright © 2003-2026 Spencer Weart & American Institute of Physics