Past Climate Cycles: Ice Age Speculations
To understand climate change, the obvious first step would be to
explain the colossal coming and going of ice ages. Scientists devised
ingenious techniques to recover evidence from the distant past, first
from deposits left on land, then also from sea floor sediments, and then
still better by drilling deep into ice. These paleoclimatologists succeeded
brilliantly, discovering a strangely regular pattern of glacial cycles.
The pattern pointed to a surprising answer, so precise that some ventured
to predict future changes. The timing of the cycles was apparently set
by minor changes in sunlight caused by slow variations of the Earth's
orbit. Just how that could regulate the ice ages remained uncertain, for
the climate system turned out to be dauntingly complex. In particular, it turned out that"greenhouse" gases like carbon dioxide played a surprisingly powerful role in governing global climate. One lesson was
clear: the system is delicately poised, so that a little stimulus might
drive a great change. (There is a separate essay on shorter-term climate
fluctuations, lasting a few years to a century or so, possibly related
to Variations of the Sun.)
Keywords: climate
change, global warming, ice ages,greenhouse effect, CO2, carbon dioxide,
methane, CH4, paleoclimate
| Subsections: Evidence and Speculations (to 1954) - Reliable Dates and Temperatures (1955-1971) -Theories Confirmed (1971-1980) - Glimpsing a Greenhouse Future (1980s to Present) |
"The origin of these climatic trends... is a difficult subject: by long tradition the happy hunting ground for robust speculation, it suffers because so few can separate fact from fancy." — G.S. Callendar(1)
| It was an incredible claim, yet the evidence was eloquent. The scraped-down rock beds, the boulders perched wildly out of place, the bizarre deposits of gravel found all around northern Europe and the northern United States, all these looked exactly like the effects of Alpine glaciers — only far, far larger. By the late 19th century, after passionate debate, most scientists accepted the incredible. Long ago (although not very long as geological time went, for Stone Age humans had lived through it), northern regions had been buried kilometers deep in continental sheets of ice. This Ice Age stood as evidence of a prodigious climate change. | - LINKS -
|
| Toward the end of the 19th century, field studies by geologists turned up another fact, almost as surprising and controversial. There had been not one Ice Age but several. The stupendous ice sheets had slowly ground south and retreated, time and again. The series of glacial periods had alternated with times of warmer climate, each cycle lasting many tens of thousands of years. German geologists, meticulously studying the scars left by ancient rivers on what were now hillsides in the Alps, worked out a scheme of four major cycles.(1a) | |
| Geologists turned up evidence that the past few million years, during which the ice sheets cycled back and forth, was an unusual time in the Earth's history. They gave it a name of its own, the Pleistocene epoch. Before that there had been long eras of less turbulent climate, when fossils of tropical plants and animals had been deposited in regions that were now frigid. Much farther back there had been a few other relatively brief epochs of glaciation, revealed by very ancient ice-scraped rocks and gravel deposits. Most geologists concluded that the planet’s climate had at least two possible states. The most common condition was long temperate epochs, like the balmy times of the dinosaurs. Much rarer were glacial epochs like our own, lasting a few millions of years, in which glacial ice ages alternated with warmer "interglacial" periods like the present. This essay does not cover studies of the very remote past, before the Pleistocene. |
|
| What could explain the change from a warm to a glacial epoch, and the cycling of ice ages within a glacial epoch? A solution to the puzzle would bring deep satisfaction and eternal fame to whoever solved it. Perhaps the solution would also tell when the next ice age might descend upon humanity — and would reveal mechanisms that could produce other kinds of climate change.. | |
| Evidence and Speculations (to 1954) | |
| From the mid-19th to the mid-20th century, many theories were offered to explain the ice ages and other climate changes. None amounted to more than plausible hand-waving. Most favored were ideas about how the uplift of mountain ranges, or other reconfigurations of the Earth's surface, would alter the circulation of ocean currents and the pattern of winds. Other theories ranged from the extraterrestrial, such as a long-term cyclical variation of solar energy, to the deep Earth, such as massive volcanic eruptions. All these theories shared a problem. Given that something had put the Earth into a state conducive to glaciation, what made the ice sheets grow and then retreat, over and over again? None of the theories could readily explain the cycles. | Full discussion in |
| Many things in the natural world come and go in cycles, so it was natural for people to suppose that there was a regular pattern to the ebb and flow of ice sheets. After all, there was evidence — convincing to many meteorologists, although doubted by as many more — that temperature and rainfall varied in regular cycles on human timescales of decades or centuries. The epochs of repeated ice ages likewise seemed to follow a cyclical pattern, on a far grander timescale. A series of repeated advances and retreats of the ice was visible in channels carved by glacial streams and in the fossil shorelines of lakes in regions that were now dry. If the pattern of advance and retreat could be measured and understood, it would give a crucial clue to the mystery of ice ages. |
|
| Simple observations of surface features were joined by inventive methods for measuring what a region's climate had been like thousands or even millions of years ago. In particular, from the early 20th century forward, a few scientists in Sweden and elsewhere developed the study of ancient pollens ("palynology"). The tiny but amazingly durable pollen grains are as various as sea shells, with baroque lumps and apertures characteristic of the type of plant that produced them. One could dig up soil from lake beds or peat deposits, dissolve away in acids everything but the sturdy pollen, and after some hours at a microscope know what kinds of flowers, grasses or trees had lived in the neighborhood at the time the layer of lake-bed or peat was formed. That told scientists much about the ancient climate. We had no readings from rain gauges and thermometers 50,000 years ago, but pollen served as an accurate "proxy." | |
| Studying ancient pollens, scientists found again a sequence of colder and warmer spells, glacial and interglacial periods. The most recent ice age had ended ten thousand years or so ago. Other ingenious studies suggested that a particularly warm period had followed. For example, fossil hoards of nuts collected by squirrels revealed that five thousand or so years ago, hazel trees had grown farther north in Sweden than at present. Were we drifting toward another ice age?(2) |
|
| The problem that researchers set themselves was to find a pattern in the timing of the changes. Unfortunately, there were no tools to accurately determine dates so far in the past; any figure might be wrong by thousands of years. That did not stop people from seeing regular patterns. An example was a 1933 study of ancient beach deposits by W.M. Davis. As the continental ice sheets formed and then melted, they had locked up and then released so much water that the oceans had dropped and risen many tens of meters. Wave-carved fossil shores stood as testimony of the different sea levels. Davis believed he saw a pattern, in which the warm interglacial periods were long. Our own time seemed near to the preceding ice age, so he concluded that the Earth ought to get warmer for a while before it cooled again. When this was added to reports that the climate of the 1930s was measurably getting warmer, predictions appeared in Science magazine and in the public press that "The poles may become useful and inhabited places."(3) |
|
| The pattern of past changes, no matter how accurately geologists might measure it, would always be suspect until a plausible theory explained it. Of all the proposed theories, only one was bound by its very nature to give regular cycles of change. This theory promised, moreover, to give the timing of past changes precisely from basic physical principles, and to predict future ice ages. The history of the measurement of ancient climates is inseparable from the history of this "astronomical" theory. | |
| In the mid 19th century, James Croll, a self-taught British amateur scientist, published calculations of how the gravitational pulls of the Sun, Moon, and planets subtly affect the Earth's motion and orientation. The inclination of the Earth's axis and the shape of its orbit around the Sun oscillate gently in cycles lasting tens of thousands or hundreds of thousands of years. During some periods the Northern Hemisphere would get slightly less sunlight during the winter than it would get during other centuries. Snow would accumulate. Croll argued that this would change the pattern of trade winds, leading to the deflection of warming currents like the Gulf Stream, and finally a self-sustaining ice age. The timing of such changes could be calculated exactly using classical mechanics (at least in principle, for the mathematics were thorny). Croll believed that the timing of the astronomical cycles, tens to hundreds of thousands of years long, roughly matched the timing of ice ages.(4*) |
|
| Most scientists found Croll's ideas unconvincing, and his timing of the ice ages wholly wrong.(5) Nevertheless a few enthusiasts pursued his astronomical theory. It became almost plausible in the hands of the Serbian engineer Milutin Milankovitch. Working in the 1920s and 1930s, he not only improved the tedious calculations of the varying distances and angles of the Sun's radiation, but also applied an important new idea. Suppose there was a particular season when the sunlight falling in a given hemisphere was so weak, even in the summer, that the snow that fell in high latitudes in winter did not all melt away? It would build up, year after year. As others had pointed out, a covering of snow would reflect away enough sunlight to help keep a region cold, giving an amplifying feedback. Under such circumstances, a snowfield could grow over the centuries into a continental ice sheet. Milankovitch was encouraged by Wladimir Köppen, an eminent climatologist, who pointed out that the sensitive zone would lie between the latitudes of 55 and 65 degrees north (where moraines marked the edge of past continental ice sheets). Milankovitch ground through calculations for the slow variations of the angle that sunlight fell in that particular zone, especially in summer. Comparing the calculations with geological evidence for the timing of past ice ages, Köppen pronounced a good match.(6) |
|
| "The possibility of dating the varying episodes of the Pleistocene ice ages by correlating them with the [Milankovitch] radiation curve appealed to a number of workers," a meteorologist reported in 1940. "Correlations with the radiation curve were found everywhere."(7) It was also encouraging that even the tiny changes in solar radiation that came with the eleven-year sunspot cycle had some effect on weather — at least according to some studies. By the 1940s, some climate textbooks were teaching that Milankovitch's theory gave a plausible solution to the problem of timing the ice ages.(8) |
|
| Supporting evidence came from "varves," a Swedish word for the pairs of layers seen in the mud covering the bottom of northern lakes. Each year the spring runoff laid down a thin layer of silt followed by a settling of finer particles. From bogs and outcrops where the beds of fossil lakes were exposed, or cores of slick clay drilled out of living lakes, researchers painstakingly counted and measured the layers. Some reported finding a 21,000-year cycle of changes. That approximately matched the timing for a wobbling of the Earth's axis which Milankovitch had calculated as a crucial element (namely, the cycle of seasons determined by the 26,000-year precession of the equinoxes combined with a longer precession of the entire elliptical orbit).(9) | |
| Most geologists, however, dismissed the astronomical theory. For contrary to the optimistic Köppen, they could not fit Milankovitch’s timing to the accepted sequence of four ice ages. A generation of geologists had laboriously constructed this sequence from studies around the world of surface features, such as the gravel deposits (moraines) that marked where glaciers had halted. The Milankovitch theory, wrote one authority condescendingly in 1957, had served a useful function as "a dogma of faith" that had stimulated research, but compared with the actual glacial record, the orbital chronology "must be stamped as illusory." Another problem lay in the fact that ice sheets had spread at the same time in the Northern and Southern Hemispheres. Since the astronomical theory relied upon an increase in the sunlight falling on one hemisphere along with a decrease on the other hemisphere, many experts considered the world-wide pattern of ice ages a devastating refutation.(10) Finally, there was a basic physical argument against the theory which seemed insurmountable. | |
| One reviewer — who had himself seen 21,000-year variations in lake deposits — explained at a 1952 conference that it was a problem of magnitudes. The computed variations in the angle and intensity of incoming sunlight were only tiny changes, "insufficient to explain the periods of glaciation."(11) Meanwhile, the studies that had found correlations between sunspot cycles and weather had all turned out wrong, giving an air of cranky unreliability to every connection between solar radiation variations and climate. That same year, a leading American planetary scientist wrote a European colleague to ask how the astronomical theory stood over there, remarking that "People I have consulted in this country... are not impressed by this work." His correspondent replied, "I have discussed the question of the appraisal of Milankovitch's theory with colleagues here. They are of the opinion that the theory cannot account for past changes. The effects are too small and the chronology of the occurrence of glaciation is so uncertain that any correspondence... appears fortuitous."(12) So what had caused the ice ages? That was still anybody's guess. |
|
| Reliable Dates and Temperatures
(1955-1971) TOP OF PAGE |
|
| The tool that would unlock the secret was constructed in the 1950s, although it took scientists a decade to make full use of it. This tool was radiocarbon dating. It could tell with surprising precision the age of features like a glacial moraine. You only needed to dig out fragments of trees or other organic material that had been buried thousands of years ago, and measure the fraction of the radioactive isotope carbon-14 in them. Of course researchers had to devise and test a number of laboratory techniques before they could get trustworthy results. Once that was done, they could assign a timescale to the climate fluctuations that had previously been sketched out by various traditional means. The best of these means, in the 1950s, was pollen science. The study of ancient climates had turned out to be invaluable for identifying strata as an aid to oil exploration, and that had paid for specialists who brought the technique to a high degree of refinement.(13) Carbon-14 measurements could now assign accurate dates to the palynologists’ tables of cool and warm periods in northern regions. For example, dating of lake deposits in the Western United States showed surprisingly regular cycles of drought and flood — which seemed to match the 21,000-year cycle predicted by Milankovitch. But other carbon-14 dates seemed altogether out of step with the Milankovitch timetable. |
|
| The swift postwar development of nuclear science meanwhile fostered another highly promising technique. In 1947, the nuclear chemist Harold Urey discovered a way to measure ancient temperatures. The key was in the oxygen built into fossil sea shells. The amount of heavier or lighter oxygen isotopes that an organism took up from seawater varied according to the water's temperature when it was alive, so the ratio (O18/O16 ) served as a proxy thermometer.(14) This ingenious method was taken up by Cesare Emiliani, a geology student from Italy working in Urey's laboratory at the University of Chicago. Emiliani measured the oxygen isotopes in the microscopic shells of foraminifera, a kind of ocean plankton. Tracking the shells layer by layer in long cores of clay extracted from the seabed, he found a record of temperature variations. Emiliani's 1955 paper, a landmark of paleoclimatology, provided the world's first high-quality record of ice age temperatures.(15) |
|
| Historians usually treat techniques as a stodgy foundation, unseen beneath the more exciting story of scientific ideas. Yet techniques are often crucial, and controversial. The stories of two especially important cases are explored in short essays on Uses of Radiocarbon Dating and Temperatures from Fossil Shells. | |
| Emiliani tentatively identified the rises and dips of temperatures with the geologists' traditional chronology of the past three ice ages. His efforts were motivated largely by a desire to learn something about the evolution of the human race, which had surely been powerfully influenced by the climate shocks of the ice ages. But his results turned out to tell less about the causes of human evolution than about the causes of climate change. To get a timescale connecting the temperature changes with depth down the core, he made carbon-14 measurements covering the top few tens of thousands of years (farther back there was too little of the isotope to measure). That gave him an estimate for how fast sediments accumulated on the seabed at that point. Emiliani now found a rough correlation with the varying amount of sunlight that, according to Milankovitch's astronomical calculations, struck high northern latitudes in summer. To get the match he had to figure in a lag of about five thousand years. That seemed reasonable, considering how long it would take a mass of ice to react. "A causal connection is suggested but not proved," Emiliani concluded.(16*) | |
| The chemist Hans Suess, another graduate of Urey's lab, took the lead in improving the carbon-14 chronology. He reported, among other things, that the last ice age had come to a surprisingly abrupt end, starting sometime around 15,000 years ago. Looking farther back, Suess found hints of a roughly 40,000-year cycle, which sounded like the 41,000-year cycle that Milankovitch had computed for slight variations in the inclination of the Earth's axis.(17) Emiliani too, reporting a cycle of roughly 50,000 years, was increasingly confident that orbital changes set the timing of ice ages.(18) His curves, however, did not match up with the canonical four ice ages. |
|
| To resolve the issue, Emiliani began urging colleagues to launch a major program and pull up truly long cores, a hundred-meter record covering many hundreds of thousands of years. But for a long time the drillers' crude techniques were incapable of extracting long, undisturbed cores from the slimy ooze. As one of them remarked ruefully, "one does not make wood carvings with a butcher's knife."(19) | |
| In the early 1960s suggestive new evidence was dug up (literally) by the geochemist Wallace Broecker and collaborators. Ancient coral reefs were perched at various elevations above the present sea level on islands that geological forces were gradually uplifting. The fossil reefs gave witness to how sea level had risen and fallen as ice sheets built up on the continents and melted away. The coral could be dated by hacking out samples and measuring their uranium and other radioactive isotopes. These isotopes decayed over millennia on a timescale that had been accurately measured in nuclear laboratories. Unlike carbon-14, the decay was slow enough so there was still enough left to measure after hundreds of thousands of years. As a check, the sea level changes could be set alongside the oxygen-isotope temperature changes measured in deep-sea cores. Again the orbital cycles emerged, plainer than ever. At a conference on climate change held in Boulder, Colorado in 1965, Broecker announced that "The Milankovitch hypothesis can no longer be considered just an interesting curiosity."(20) People at the conference began to speculate on how the calculated changes in sunlight, although they seemed insignificantly small, might somehow trigger ice ages. That could happen if the climate system were so delicately balanced that a small push could prompt it to switch between different states. |
|
| Meanwhile oceanographers managed to extract a fine set of cores that reached back more than 400,000 years. Analyzing the cores, Emiliani announced he could not make the data fit the traditional ice ages timetable at all. He rejected the entire scheme, painstakingly worked out around the end of the 19th century in Europe and accepted by generations of geologists, of a Pleistocene epoch comprising four major glacial advances alternating with long and equable interglacial periods. Emiliani said the interglacials had been briefer, and had been complicated by irregular rises and falls of temperature, making dozens of ice ages.(21) Many other scientists found his chronology dubious, but he defended his position tenaciously. Most significantly, he believed the sequence correlated rather well with the complex Milankovitch curve of summer sunlight at high northern latitude. Calculating how the cycle should continue in the future, in 1966 Emiliani predicted that "a new glaciation will begin within a few thousand years."(22) It was a step toward what would soon become widespread public concern about future cooling. |
|
| Seldom was such work straightforward. Geologists defended their traditional chronology passionately and skillfully. For a few years they held their ground, for it turned out that Emiliani's data on oxygen isotopes taken up in plankton shells did not directly measure ocean temperatures after all. Emiliani fiercely defended his position, but other workers in the late 1960s convinced the scientific community that he was mistaken. When water was withdrawn from the oceans to form continental ice sheets, the heavier and lighter isotopes evaporated and fell as rain or snow in different proportions. The way plankton absorbed oxygen at a given temperature mattered less than what proportion of each isotope was available in the seawater as ice sheets came and went. | |
| Yet in a deeper sense Emiliani was vindicated. Whatever the forces that changed the isotope ratio, its rise and fall did represent the coming and going of ice ages. "Emiliani's 'paleotemperature' curve," the new findings revealed, "...may be renamed a 'paleoglaciation' curve."(23*) | |
| These changes did turn out to correlate with ocean surface temperatures. New evidence for that came from scientists who took a census of the particular species of foraminifera, recognizing that the assemblage of different species varied with the temperature of the water where the animals had lived. The data confirmed that there had been dozens of major glaciations during the past couple of million years, not the four or so enshrined in textbooks. Corroborating evidence came from a wholly different type of record. In a brick-clay quarry in Czechoslovakia, George Kukla noticed how wind-blown dust had built up into deep layers of soil (what geologists call "loess"). Although Kukla could not get dates that matched Emiliani's, the multiple repetitions of advance and retreat of ice sheets were immediately visible in the colored bands of different types of loess. It was one of the few cases in this story where traditional field geology, tramping around with your eyes open, paid a big dividend. |
|
| In 1968, still more complete and convincing evidence came from an expedition that Broecker and a few others took to Barbados. Terraces of ancient coral covered much of the island, rising to hundreds of meters above the present sea level. The dates for when the coral reefs had been living (125,000, 105,000, and 82,000 years ago) closely matched dates from Milankovitch cycles for times when the ice sheets should have been melted and the seas at their highest (127,000, 106,000, and 82,000 years ago). The dating matched, that is, so long as one looked for the times when the maximum amount of sunlight struck a particular band of mid-northern latitudes during the summer. "The often-discredited hypothesis of Milankovitch," declared Broecker and his collaborators, "must be recognized as the number-one contender in the climatic sweepstakes."(24*) | |
| Since the Milankovitch cycles could be computed directly from celestial mechanics, one could project them forward in time, as Emiliani had done in 1966. In 1972, presenting more Caribbean cores, he again advised that "the present episode of amiable climate is coming to an end." Thus "we may soon be confronted with... a runaway glaciation." (He meant "soon" as geologists reckoned time, in centuries or millennia.) However, he added, greenhouse effect warming caused by human emissions might overwhelm the orbital shifts, so we might instead face "a runaway deglaciation."(25) | |
| Some other scientists agreed that the current interglacial warm period had peaked 6,000 or so years ago, and should be approaching its natural end. A prominent example was Kukla, continuing his study of loess layers in Czechoslovakia. He could now date the layers thanks to a new technique provided by other scientists. Geological and oceanographic studies had shown that over the course of millions of years, from time to time the Earth's entire magnetic field flipped: the North magnetic pole became the South magnetic pole and vice-versa. These reverses were recorded where layers of sediment or volcanic lava had entombed the direction of the magnetic field at the time. Geologists had worked out a chronology in lava flows, dated by the faint radioactivity of an isotope of potassium that decayed very slowly.(26) If even one magnetic-field reversal could be identified in any set of layers, it pinned down the timing of the entire sequence. When the loess layers were dated in this fashion, Milankovitch cycles turned up. Extrapolating the cycles into the future, Kukla thought the next shift to an ice age "is due very soon." (To geologists of the time, "very soon" meant within a few thousand years, although Kukla and a few others thought cooling might possibly become severe within a century or two.)(27) |
=>Aerosols |
| If the climate experts of the time seem to have been a bit preoccupied with ice ages, that fitted their training and interests. For a hundred years their field had concerned itself above all with the ice ages. Their techniques, from pollen studies to sea floor drilling, were devoted to measuring the swings between interglacial and glacial periods. Home at their desks, they occupied themselves with figuring how ice age climates had differed from the present, and attacking the grand challenge of explaining what might cause the swings. Now that they were beginning to turn their attention from the past to the future, the most natural meaning to attach to "climate change" was the next swing into cold.(28) | |
| In 1972, a group of leading ice-age experts met at Brown University to discuss how and when the present warm interglacial period might end. A large majority agreed that "the natural end of our warm epoch is undoubtedly near." Near, that is, as geologists reckoned time. Unless there were impacts from future human activity, they thought that serious cooling "must be expected within the next few millennia or even centuries."(29) But many other scientists doubted these conclusions. They hesitated to accept the Milankovitch theory at all unless they could get definitive proof from some entirely different kind of evidence. | |
| Theories Confirmed (1971-1980) TOP OF PAGE | |
| The Greenland ice sheet is a daunting sight. Most investigators first come to it by air, past colossal bare cliffs where unimaginable quantities of ice pour down to the sea in a slow-motion flood. Beyond that the landscape rises and rises, over entire mountain ranges hidden under ice, to a limitless plain of gently undulating white. Greenland had played an important role in the 19th-century controversy over the ice ages. A few geologists had dared to postulate the existence, in the distant past, of seas of solid ice kilometers thick. Then astonished explorers of Greenland found just such a thing beneath their skis. |
|
| In the late 1950s scientists came back to Greenland, hoping to find the key to the history of climate change. The logistics were arduous. But there was good support thanks to the International Geophysical Year — backed up by the United States government's concern to master the Arctic regions that lay on the shortest air and missile routes to the Soviet Union. The Americans buried an entire military base, Camp Century, in the ice. Their secret aim was to test whether it was practical to hide ballistic missiles there (it wasn't), but the public face was innocent scientific research. Among other projects, workers drilled short cores from the ice to demonstrate that it could be done. An improved drill, brought onto the ice in 1961, produced glistening cores 5 inches in diameter in segments several feet long. This was no small feat in a land where removing your gloves for a few minutes to adjust something might cost you the skin on your fingertips, if not entire fingers. After another five years of difficult work, organized by the U.S. Army's Cold Regions Research and Engineering Laboratory, the drill at Camp Century reached bedrock. The hole reached down some 1.4 kilometers (7/8 of a mile), bringing up ice as much as 100,000 years old.(30*) Two years later, in 1968, another long core of ancient ice was retrieved from a site even colder and more remote: Byrd Station in West Antarctica.(31) |
|
| Much could be read from these cores. For example, individual layers with a lot of acidic dust pointed to past volcanic eruptions. Individual eruptions could be assigned dates simply by counting the annual layers of ice.(32) (Known eruptions like the destruction of Pompeii in the year 79 gave a check on the counts.) Farther down the layers became blurred, but approximate dates could still be assigned. Deep in the ice there were large amounts of mineral dust, evidence that during the last ice age the world had been windier, with storms carrying dust clear from China. Still better, ancient air had been trapped and preserved as bubbles in the ice, a million tiny time capsules packed with information about past climates. However, for a long time nobody could figure out how to extract and measure the fossil air reliably. |
|
| In the early years, the most useful work was done using the frozen water itself. The method had been worked out back in 1954 by an ingenious Danish scientist, Willi Dansgaard. He showed that the ratio of oxygen isotopes (O18/O16) in the ice measured the temperature of the clouds at the time the snow had fallen — the warmer the air, the more of the heavy isotope got into the ice crystals.(33) It was an exhilarating day for the researchers at Camp Century, making measurements along each cylinder of ice after it was pulled up from the borehole, when they saw the isotope ratios change and realized they had reached the last ice age. The preliminary study of the ice cores, published in 1969, showed variations that indicated an average temperature change of perhaps 10°C (that is, 18°F). Some cycles were tentatively identified, including one with a 13,000 year length.(34) |
|
| An ice core tells the story of only one tiny spot on the planet. The early scientific reports were careful not to claim that their data reflected the climate of the entire globe. But by 1970 comparison of Greenland and Antarctic cores showed that the climate changes were truly global, coming at essentially the same time in both hemispheres. That contradicted some cherished theories of the ice ages and put a strict constraint on the possible causes of the cycles.(35) | |
| There is a supplementary site on the History of Greenland Ice Drilling, with some documentation of the U.S. "GISP" projects of the 1980s. | |
| Ice core studies also confirmed a feature that researchers had already noticed in deep-sea cores: the glacial cycle followed a sawtooth curve. In each cycle, a spurt of rapid warming was followed by a more gradual, irregular descent back into the cold over tens of thousands of years. A closer look showed that temperatures tended to cluster at the two ends of the curve. It seemed that the climate system had two fairly stable modes, brief warmth and more enduring cold, with relatively rapid shifts between them. Warm intervals like the past few thousand years normally did not last long.(36) Beyond such fascinating hints, however, the Greenland ice cores could say little about long-term cycles. They were too short to reach past a single glacial cycle. And the ice flowed like tar at great depths, confusing the record. In the 1970s, despite the arduous efforts of the ice drillers, the most reliable data were still coming from deep-sea cores. | |
| That work too was strenuous and hazardous, manhandling long wet pipes on a heaving deck. Oceanographers (like ice drillers) lived close together for weeks or months at a time under Spartan conditions, far from their families. The teams might function smoothly — or not. Either way, the scientists labored long hours, for the problems were stimulating, the results could be exciting, and dedication to work seemed normal with everyone around them doing the same. | |
| To make it worthwhile, scientists had to draw on all their knowledge and luck to find the right places to drill on the ocean bed. In these few places, layers of silt had built up unusually swiftly and steadily and without disturbance. Meanwhile, drilling techniques were finally worked out that could extract the continuous hundred-meter cores of clay that Emiliani had been asking for since the 1950s. Improved techniques for measuring the layers gave data good enough for thorough analysis. | |
| The most prominent feature turned out to be a 100,000-year cycle — evidently a key to the entire climate puzzle. Several earlier studies had tentatively identified this long-term cycle. Corroboration was in hand from Kukla's loess layers in Czechoslovakia, at the opposite end of the world from some of the deep-sea cores. Here too the 100,000-year cycle stood out.(37) | |
| Yet nobody could be entirely sure. Radiocarbon decayed too rapidly to give dates going back more than a few tens of thousands of years. A deeper timescale could only be estimated by measuring lengths down a core, and it was uncertain whether the sediments were laid down at a uniform rate. For a decade controversy had smoldered between Emiliani, as usual sticking by his original position, and other scientists who felt that his chronology was seriously in error. According to their data, the prominent cycle he had seen and attributed to the 41,000-year orbital shifts was actually the 100,000-year cycle.(38) Here again Emiliani had been bogged down by erroneous assumptions, yet somehow had muddled through to the fundamental truth that Milankovitch cycles were real. | |
| In 1973, Nicholas (Nick) Shackleton nailed it all down for certain. What made it possible was the new magnetic-reversal dates established by radioactive potassium, plus Shackleton's uncommon combination of technical expertise in different fields. A splendid deep-sea core had been pulled — "one of the best and most complete records of the entire Pleistocene that is known" — the famous core Vema 28-238 (named after the Lamont Observatory's oceanographic research vessel, a converted luxury yacht). It reached back over a million years, and included the most recent reversal of the Earth's magnetic field, which geologists dated at a bit over 700,000 years ago. This calibrated the chronology for the entire core. As a further benefit, Shackleton managed to extract and analyze the rare shells of foraminifera plankton that lived in the deep sea, and which reflected basic oceanic changes independent of the fluctuating sea-surface temperatures. The deep-sea foraminifera showed the same isotopic variations as surface ones, confirming that the variations gave a record of the withdrawal of water to form ice sheets. When Shackleton showed his graph of long-term change to a roomful of climate scientists, a spontaneous cheer went up.(39*) |
|
| The core Vema 28-238 and a few others contained such a long run of consistent data that it was possible to analyze the numbers with a mathematically sophisticated "frequency-domain" calculation, a well-established technique for picking out the lengths of cycles in a set of data.(40) Detailed measurements and numerical calculations found a set of favored frequencies, a spectrum of regular cycles visible amid the noise of random fluctuations. The first unimpeachable results (well, almost unimpeachable) were achieved in 1976 by James Hays, John Imbrie and Shackleton. The trio not only analyzed the oxygen-isotope record in selected cores from the Indian Ocean, but checked their curves against temperatures deduced from the assemblage of foraminifera species found in each layer. | <=Uses of shells |
| The long cores proved beyond doubt what Emiliani had stoutly maintained — there had been not four major ice ages, but dozens. The analysis showed cycles with lengths roughly 20,000 and 40,000 years, and especially the very strong cycle around 100,000 years, all in agreement with Milankovitch calculations.(41) Extrapolating the curves ahead, the group predicted cooling for the next 20,000 years. As Emiliani, Kukla, and other specialists had already concluded several years earlier, the Earth was gradually — indeed, perhaps quite soon as geologists reckoned time — heading into a new ice age (see above). | =>Modern temp's =>Public opinion =>Climate mod =>Simple models = Milestone |
| These results, like so many in paleoclimatology, were promptly called into question.(42) For one thing, there was no solid reason to suppose that our current interglacial period would be of average length and was therefore nearing its end. But the main results withstood all criticism. Confirmation came from other scientists who likewise found cycles near twenty and forty thousand years, give or take a few thousand. The most impressive analysis remained the pioneering work of Hays, Imbrie, and Shackleton. They could even split the 20,000 year cycle into a pair of cycles with lengths of 19,000 and 23,000 years — exactly what the best new astronomical calculations predicted. By the late 1970s, most scientists were convinced that orbital variations acted as a "pacemaker" to set the timing of ice ages.(43) Science magazine reported in 1978 that the evidence for the Milankovitch theory was now "convincing," and the theory "has recently gained widespread acceptance as a factor" in climate change.(44) |
|
| Yet the cause of the ice ages remained more a mystery than ever. How could the "pacemaker" possibly work? The variation in the intensity of sunlight that was computed for the 100,000-year astronomical cycle came from a minor change in orbital eccentricity — a slight stretching of the Earth's path around the sun out of a perfect circle. It was a particularly tiny variation; the changes it caused should be trivial compared with the shorter-term and larger orbital shifts, not to mention all the other influences on climate. Yet it was the 100,000-year cycle that dominated the record. Scientists began to turn from hunting down cycles to searching for the physical mechanisms that could make the climate system respond so dramatically to subtle changes in sunlight. As a reviewer admitted, "failures to support the Milankovitch theory may only reflect the inadequacies of the models."(45) A number of people took up the challenge, devising elaborate numerical models that took into account the sluggish dynamics of continental ice sheets. It seemed likely that eventually the modelers would produce a suite of feedbacks that would entirely explain the schedule of the ice ages. | <=Simple models |
| Glimpsing a Greenhouse Future (1980s to Present) TOP OF PAGE | |
| During the 1980s, the work advanced steadily with few surprises. Ocean drilling in particular, pursued on an international scale, produced ever better cores. A costly project dedicated to "spectral mapping" (SPECMAP) yielded a spectrum of cycles that matched the astronomical calculations with gratifying precision going back hundreds of millennia. Five separate cores confirmed that variations in the Earth's orbit drove the coming and going of ice ages.(46) But an unexpected finding brought in a new complication. The prominent 100,000-year cycle had dominated climate change only during the most recent million years. During a long earlier phase of the Pleistocene epoch, the rise and decay of ice sheets had followed the 41,000-year cycle (related to shifts in the inclination of the Earth's axis).(47) Milankovitch and his followers had originally expected that this cycle would have a much stronger effect than the feeble 100,000-year shifts in the eccentricity of the Earth's orbit. They had recognized, however, that the 41,000-year variations in sunlight themselves might have been too small to cause ice ages without some kind of amplification. The experts understood that "the response characteristics of the Earth's climate system have themselves evolved," so that the details of cycling could well change.(48) The shift in the dominant cycle surely gave a clue, if an enigmatic one, to the variety of feedback mechanisms at work. |
|
| Meanwhile ice drillers, reaching ever farther into the past at locations where the flow of ice in the depths did not introduce too much confusion, joined the deep-sea drillers as a main source of information. The ice and seabed climate curves were found to go up and down in fine agreement, and researchers began to combine data from both sources in a single discussion. The most striking news from the ice was evidence that the level of carbon dioxide gas (CO2) in the atmosphere had risen and fallen more or less in time with the temperature. | |
| The outstanding record was extracted at the Soviet Union's Vostok Station in Antarctica. It was a truly heroic feat of technology, wrestling with drills stuck a kilometer down at temperatures so low that a puff of breath fell to the ground in glittering crystals. Vostok had been established during the 1957-58 International Geophysical Year at the coldest and most inaccessible place on the planet. Supplies were brought once a year by a train of vehicles that clawed across 1400 kilometers of ice. Underfunded and threadbare, the station was fueled by the typically Russian combination of cabbage, cigarettes, vodka, and stubborn persistence. ("What do you do for recreation?" "Wash... you have a bath once every ten days.") In 1982 a fire destroyed the main generator; the crew survived the winter crammed into a small hut heated by wicks dipped in diesel oil.(49) |
|
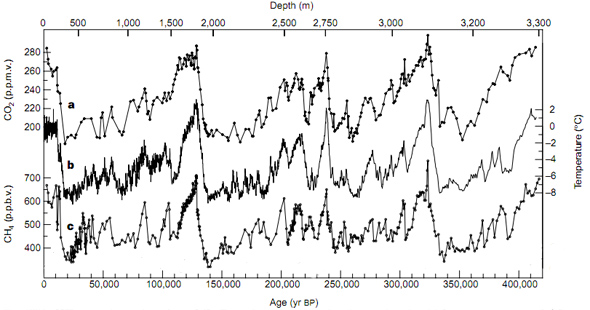
| Nothing stopped them. While the Greenland record reached into the most recent ice age, by 1985 the Antarctic team had pulled up cores of ice stretching clear through the cold period and into the preceding warm period—a complete glacial cycle. As Soviet funding ran dry, a French team joined them to analyze the cores.(50) They found that during the cold part of the cycle the CO2 level had been much lower than during the warm periods before and after. The low level had already been reported from a Greenland core, but with a full cycle in hand it was obvious that the curves of gas level and temperature tracked one another remarkably closely. Measurements in the ice of an even more potent greenhouse gas, methane, showed a similar rise and fall that matched the rise and fall of temperature.(51) This work fulfilled the old dream that studying the different climates of the past could be almost like putting the Earth on a laboratory bench, switching conditions back and forth and observing the consequences. |
<=Other
gases |
| The Vostok team pointed out that the swings in greenhouse gas levels might be amplifying the effect of the orbital shifts. A small rise or fall in temperature seemed likely to cause a rise or fall in the gas levels (for example, when seawater got warmer it would evaporate some CO2 into the atmosphere, whereas it would absorb the gas during a cooling period). More or less greenhouse gases in the atmosphere would make for further changes in temperature, which would in turn raise or lower the gas levels some more... and so on. It was the first truly plausible theory for how minor shifts of sunlight could make the entire planet's temperature lurch back and forth. |
|
| The changes in the atmosphere also answered the old persuasive objection to Milankovitch's theory — if the timing of ice ages was set by variations in the sunlight falling on a given hemisphere, why didn't the Southern Hemisphere get warmer as the Northern Hemisphere cooled, and vice-versa? The answer was that changes in atmospheric CO2 and methane physically linked the two hemispheres, powerfully warming or cooling the planet as a whole.(52*) |
|


Variations over 420,000 years of CO2, methane(CH4), and temperature, from the Vostok ice core after it reached bedrock (1999): four complete glacial cycles. |
| Looking at the rhythmic curves of past cycles, one could hardly resist the temptation to extrapolate into the future. By the late 1980s, most calculations had converged on the familiar prediction that the natural Milankovitch cycle should bring a mild but steady cooling over the next few thousand years. As climate models and studies of past ice ages improved, however, worries about a swift descent into the next great glaciation — what many in the 1970s had tentatively expected — died away. New calculations said that while slow cooling could be expected, the next full ice age would not come naturally within the next ten thousand years or so. The calculations were backed up in 2004 by data from a heroic new drilling effort in Antarctica that brought up ice spanning the past eight glacial cycles. Among these was an unusually long previous cycle where the orbital elements had been similar to those in our own cycle. On the other hand, in 2012 a team using a different ancient cycle as an analogy to the present claimed that the world should indeed be descending into an ice age within the next few thousand years.(53*) | |
| The scientists who published these calculations always added a caveat. In the Antarctic record, atmospheric CO2 levels over the past 750,000 years had cycled between about 180 and 280 parts per million. The level by 2012 had climbed almost to 400 and kept climbing. (The other main greenhouse gas, methane, was soaring even farther above any level seen in the long ice record.) Greenhouse warming and other human influences seemed strong enough to overwhelm any natural trend. One scientist, paleoclimatologist William Ruddiman, even argued that the rise of human agriculture had already produced enough greenhouse gases to counteract the gradual cooling that should have come during the past several thousand years; every previous cycle had begun a steady cooling soon after its peak, rather than leveling off as ours had done.(53a) As emissions climbed exponentially, we might not only cancel the next ice age but launch our planet into an altogether new climate regime. | |
| The ice cores themselves gave convincing evidence of the threat, according to analyses published beginning in the early 1990s. The "climate sensitivity" — the long-term response of temperature to changes in carbon dioxide — could be measured for the last glacial maximum. The answer was in the same range that computer models were predicting for our future, namely, about 3°C of warming, give or take a degree or so, if the CO2 level doubled. It was just the same range that the models got. Drilling continued, excavating ever earlier glacial periods; by 2008 the team could declare that "atmospheric carbon dioxide is strongly correlated with Antarctic temperature throughout eight glacial cycles." Meanwhile paleontologists used a variety of techniques to show that the correlation held not only in the Pleistocene but in much earlier geological epochs, some with very different climate systems, back to the dinosaaurs and beyond. Evidently the computer modelers had not missed anything important. When scientists arrive at the same numerical result using wholly different methods, it gives them confidence that they are somehow in touch with reality.(53b*) |
|
| In climate science, where everything is subtle and complex, it is rare for an issue to be entirely settled. By the late 1980s, it did seem to be an established fact that ice ages were timed by orbital variations. But what kind of feedbacks amplified the effect? Some people challenged whether any of this was really understood. The cycles, most scientists now agreed, involved not only orbital variations in solar irradiation, but also a variety of geological effects. First came the massive creation, settling and flow of continental ice sheets, which naturally would work on a timescale of tens of thousands of years. But large-scale physical and chemical changes in the oceans might be important too. New evidence gave a particularly crucial role to changes in CO2 and other greenhouse gases, changes apparently driven not just by geochemistry and ocean circulation, but still more by changes in biological activity. And of course the biosphere depended in turn on climate — and not just temperature, but also trickier matters like fertilization of the seas by minerals eroded from glacial era deserts. Further unexpected influences were added to the list of possibilities almost every year.(54) It would take much more study to determine just what combination of effects determined the shape of glacial cycles. |
|
| In 1992, a more fundamental challenge was raised by the ingenious exploitation of a novel source of data: layers of calcite laid down in the desert oasis of Devils Hole, Nevada. The layers showed glacial and interglacial periods much like those seen in the ice cores. But the dating (using uranium isotopes) failed to agree with Milankovitch calculations. The authors suggested that the timing of ice ages followed no regular cycle at all, but was driven wholly by "internal nonlinear feedbacks within the atmosphere-ice sheet-ocean system."A vigorous controversy followed, but in the end most climate scientists stuck by the Milankovitch theory. The Devils Hole measurements looked solid, but might they not represent only a strictly local effect? By 2001 there was evidence that the Nevada temperatures were indeed local, perhaps related to changing currents in the Pacific Ocean. Yet debate over this "great paleoclimate enigma" persisted, with uncertainty about how local conditions might reconcile the Devils Hole data with the Milankovitch chronology.(55) | |
| The controversy had highlighted the complexities of the climate system. As two experts reviewing the problem put it, "climate is too complicated to be predicted by a single parameter."(56) The faint variations of summer sunlight in Northern latitudes were effective only because the astronomical schedule somehow resonated with other factors — the dynamics of continental ice sheets and tropical ocean currents, the bio-geochemical CO2 system, and who knew what else. The more precise the data got, the less precise seemed the match between sunlight in the Northern Hemisphere and ice age cycles; probably Southern Hemisphere sunlight and other Milankovitch features played a role. Evidently when orbital effects served as a pacemaker, it was by adjusting the timing of greater forces working through their own complex cycles. As one reviewer said in 2002, "The sheer number of explanations for the 100,000-year cycle... seems to have dulled the scientific community into a semipermanent state of wariness about accepting any particular explanation." |
|
| Indeed scientists were beginning to find that they had accepted the astronomical eccentricity cycle too easily. It was not just that it had only showed up a million years ago: it had never dominated at all. The supposed 100,000-year regularity was actually an average of the past eight glacial cycles, which improved measurements showed had ranged from 80,000 to 120,000 years in length.(57) | |
| The long collective trudge through the intricacies of field data and models gradually increased understanding of all the interacting forces that drive climate cycles. By around 2013 computer models of ice-sheet behvior had finally advanced to the point where modelers could get convincing glacial cycles. For example, one team found that the approximate 100,000-year cycle might be explained by the slow settling of bedrock under the colossal weight of the North American ice sheet. After several 23,000-year cycles the Earth's crust would sag so far that the ice's surface was at a low enough altitude to melt in summer — but only when orbital conditions brought increased sunlight in northern latitudes. Later, after enough ice melted, the bedrock would gradually rebound. This seemed plausible, but it was only one of several ideas about how a huge ice sheet might become unstable. For example, another team successfully modeled the past three million years of climate by adding the way the glaciers of each ice age scraped away sediments until the entire Arctic was mostly bare rock. In recent cycles the simulated glaciers could not slide easily and thus collapsed more slowly. On the other hand, a new calculation of the effects of orbital changes published in 2025 reverted to the oldest theory, assertiing that the 100,000 cycle could be entirely explained by the details of the timing of the astronomical cycles. More work would be needed before the entire pattern of interactions among ice sheets, bedrock, oceans, and the many other elements of the climate system could be well understood.(57a) |
|
| The invaluable fruit of a century of ice ages research was the recognition of how complex and powerful the feedbacks could be. An intriguing clue came from some especially good Antarctic ice core records. The levels of CO2 and methane apparently rose or fell a few centuries after a rise or fall in temperature. That seemed odd to many; wasn’t temperature supposed to respond to greenhouse gases and not the other way around? Confusion and controversy continued when a later and more precise study found the reverse, that is, CO2 rising before temperature. But the measurements were tricky—in Greenland wind-blown dust confused the chemistry, and in Antarctica snow accumulated so slowly that it was hard to tell one century from another. A search began for places at both ends of the planet where snow accumulated fast enough to give high time resolution. Cores drilled from these sites eventually showed that if there was a lag either way, it was too small to be seen amid the noise.(58) |
|
| Whatever the exact sequence, the lesson was that Milankovitch's orbital changes initiated potent feedbacks. An ice age would begin to wane when a shift in sunlight caused a slight temperature rise (the main driver was probably summer sunlight reducing snow cover in Canada and Siberia). Over the next few centuries the temperature increase would bring a small rise in gas levels. The mechanisms were debated, maybe evaporation of CO2 from the warmer oceans, maybe methane bubbling from wetlands, maybe something ridiculously complicated like ocean current shifts that changed the upwelling of nutrients in the Southern Ocean that fertilized carbon-absorbing plankton, maybe all of the above and more.(59) The greenhouse effect of the extra gases would then drive the planet's temperature a bit higher still, and that would drive a further rise in the gas levels... and so forth. | |
| Our current situation was altogether different. The warming was not started by a small shift of sunlight, as in previous epochs. Our addition of gases to the atmosphere was initiating the process, with the temperature rise lagging a few decades behind the rise of gas levels. Emissions were surging far more swiftly than anything in the Pleistocene record. Already by the 1980s the levels of greenhouse gases had climbed far higher than anything seen for many millions of years. Even if we stopped our emissions, would feedbacks drive things higher on their own? There were disturbing signs that feedbacks were indeed kicking in. Drying forests and warmer seawater were getting less efficient at taking CO2 out of the air, and methane was seen bubbling up from Arctic wetlands. |
|
| By the start of the 21st century it was clear that greenhouse gases were a major geological force. All through the Pleistocene, the CO2 and methane feedback had turned the planet's orbital cycles from minor climate variations to large transformations that affected all life on the planet. The Intergovernmental Panel on Climate Change (IPCC), charged by the world's governments with describing the consensus view of climate scientists, had been relying on complicated computer models to calculate how sensitive the planet was to the rise of greenhouse gases. But the study of gases and temperatures in the past advanced so far that in its 2021 report, the IPCC gave equal status to paleontological data. The geological record gave a striking confirmation, with wholly independent methods and data, of the processes that computer models had been predicting would bring a rapid and severe global warming — a disruption of climate exceeding anything seen since the emergence of the human species. |
|
Home
Simple Models of Climate
The Carbon Dioxide Greenhouse Effect
Changing Sun, Changing Climate
Supplement:
Temperatures from Fossil Shells
| NOTES |
1. Callendar (1961), p. 1. BACK
1a. The history is reviewed by Imbrie and Imbrie (1986) and Krüger (2013). The scheme of four ice ages was propounded by Albrecht Penck, Penck and Brückner (1901-1909). BACK
2. Nuts: G. Andersson in 1902 as cited in Lamb (1977), p. 397; for the history overall, see Lamb pp. 193, 378ff. and Webb (1980). BACK
4. Croll (1864); Croll (1875); Croll predicted glaciation when the Earth was at aphelion in winter. But summer aphelion (with the distant Sun less likely to melt the snow away) was more likely to do it, as pointed out by Murphy (1876); Croll (1886) defends his views; Imbrie and Imbrie (1979), pp. 77-88. BACK
5. For example, Arrhenius (1896), p. 274; Brooks (1922a), p. 18-19. BACK
6. Milankovitch (1920) ; Milankovitch (1930), see pp. 118-21 for additional history; Milankovitch (1941) ; for this history I have used Imbrie and Imbrie (1986). BACK
7. Simpson (1939-40), p. 203. BACK
8. E.g., Landsberg (1941, rev. ed. 1947, 1960), pp. 191-92. BACK
9. Bradley (1929) ; Zeuner (1946 [4th ed., 1958]). BACK
10. "dogma... illusory," Öpik (1957); "This theory has been answered devastatingly by... Sir George Simpson," Wexler (1952), p. 74. BACK
11. van Woerkom (1953); see also Science Newsletter (1952); similarly, "the changes of solar radiation due to changes in the Earth's orbit are always too small to be of practical importance," Simpson (1939-40), p. 209. BACK
12. Kuiper to H. Sverdrup, 28 May 1952, and reply, 11 June 1952, Box 11, G.P. Kuiper files, Special Collections, U. Ariz., kindly reported to me by Ron Doel.; similarly, the theory "has failed utterly," Humphreys (1920), pp. 564-66, quote p. 568, on the Croll theory, but repeated without change in the 3rd (1940) edition, p. 586, without reference to Milankovitch. BACK
13. Faegri et al. (1964); Manten (1966). BACK
15. Emiliani (1955); see Emiliani (1958b). BACK
16. The effect was never expected to correlate with sunlight in the Southern Hemisphere, which is mostly ocean where snow would never accumulate. Emiliani (1955), p. 509; see also Emiliani (1958a); on evolution, Emiliani (1958b) p. 63. BACK
18. Emiliani and Geiss (1959). BACK
19. Hsü (1992), pp. 30-32, 220. BACK
20. Quote: Broecker (1968), p. 139; for early work, see Broecker (1966). For a detailed account of this and following events see Broecker and Kunzig (2008), pp. 46-56. BACK
23. Dansgaard and Tauber (1969). Later work found many further refinements; any large change in precipitation or in ecosystems that processed oxygen would alter the oxygen-isotope ratio throughout the global atmosphere. For example, certain abrupt global climate changes thousands of years ago (Dansgaard-Oeschger events, see the essay on Ocean Currents) included large changes in monsoon rainfall over Asia, which produced noticeable isotope shifts, Severinghaus et al. (2009). BACK
24. "sweepstakes": Broecker et al. (1968) p. 300; as 125, 105, and 82,000 in Mesolella et al. (1969); see also summary in Broecker and van Donk (1970) .On this and the history of ice-age cycle observations in general see Broecker (2010), ch. 1. An important confirmation, using boreholes drilled in Barbados reefs now drowned, was Fairbanks and Matthews (1978); the objection that the sea level changes might be due to local uplift in Barbados, and not a world-wide phenomenon, was refuted by an expedition to another fine set of coral terraces on a rarely visited coast of New Guinea, Bloom et al. (1974); for discussion Berger (1988). BACK
27. Kukla and Kocí (1972), p. 383. BACK
28. Chambers and Brain (2002), p. 239. BACK
29. Kukla et al. (1972), p. 191; Kukla and Matthews (1972); "large majority" according to Flohn (1974), p. 385. BACK
30. The first long core (411m), using a drill developed by B. Lyle Hansen, was extracted at another site in Greenland in 1956: Dansgaard et al. (1973). Gertner (2019); for brief history and references see also Langway et al. (1985),Levenson (1989), pp. 40-41; for a firsthand account, Alley (2000). BACK
31. Epstein et al. (1970). For the first half-century of ice cores see Jouzel (2013). BACK
32. Hamilton and Seliga (1972). BACK
33. Dansgaard (1954); Dansgaard (1964); for further bibliography on gases in ice, see Broecker (1995b), pp. 279-84. BACK
34. Dansgaard et al. (1969). Exciting day: oral history interview of Klaus Hammer by Finn Aaserud, 1993, GISP interviews, records of Study of Multi-Institutional Collaborations, AIP; see Dry (2019), chap. 7; Achermann (2020). Extensive autobiographical histories are Langway (2008), Dansgaard (2005). BACK
35. Epstein et al. (1970). BACK
36. Newell (1974); using results of Johnsen et al. (1972). BACK
37. Kukla and Kocí (1972); see Schneider and Londer (1984), p. 53. BACK
38. Broecker and van Donk (1970); cf. Ericson and Wollin (1968), using foram temperatures. BACK
39. Later revised to 780,000. Shackleton and Opdyke (1973), quote p. 40. They determined temperatures by oxygen isotopes. Opdyke did the magnetic work. Cheer: John Imbrie, oral history interview by Ron Doel, 1997, AIP; see Imbrie and Imbrie (1979), p. 164. BACK
40. For history and comments, see Imbrie (1982); Imbrie and Imbrie (1979). BACK
41. Hays et al. (1976); for other work, see Imbrie et al. (1975). BACK
42. Evans and Freeland (1977). BACK
43. Hays et al. (1976); Berger (1977); other data: Berger (1978); see review, Berger (1988). BACK
45. Shift of emphasis: paraphrase of Imbrie (1982), p. 408; for example, see North and Coakley (1979); review: North et al. (1981), p. 107. BACK
46. Imbrie et al. (1984). The definitive "SPECMAP" chronology was published by Martinson et. al. (1987) BACK
47. Pisias and Moore (1981); Ruddiman et al. (1986). BACK
48. Imbrie (1982), p. 411. BACK
49. Quote: J.-R. Petit in Walker (2000). For additional details see Broecker (2010), ch. 1; Theodore Shabad, "Russians Reveal Tale of Survival in the Long Polar Winter," New YorkTimes, April 26, 1983, online here; also, S. Weart, "Vostok Station: Climate Change Is Real," Reports of the National Center for Science Education 41, no. 2 (Spring 2021), online here. BACK
50. Lorius et al.(1985); Barnola et al.(1987); Genthon et al. (1987). BACK
51. Stauffer et al. (1988). BACK
52. E.g., Pisias and Shackleton (1984); "The existence of the 100-kyr [kiloyear] cycle and the synchronism between Northern and Southern Hemisphere climates may have their origin in the large glacial-interglacial CO2 changes." Genthon et al. (1987), p. 414. BACK
53. Calculations: e.g., Berger (1988), p. 649; see Falkowski et al. (2000); Berger and Loutre (2002) discusses a long interglacial. The new Antarctic "Dome C" record of climate went back 750,000 years: EPICA community members (2004). Eight cycles: Lüthi et al. (2008). On the drilling see Flannery (2005), p. 58. See also reports in Science (November 25, 2005): 1285-87, 1313-21. Tzedakis et al. (2012); meanwhile Rohling et al. (2010) argued that even by analogy with the long past cycle (stage 11), without our emissions we should be heading already into a glacial period. BACK
53a. On Ruddiman see footnote in the essay on the biosphere. BACK
53b. Lorius et al. (1990); Hoffert and Covey (1992); Annan and Hargreaves (2006) ; Skinner (2012); PALAEOSENS (2012). N.b. this diverges from the commonly used "Charney sensitivity" which describes temperature change over the next century or so, and which is less than the change expected over the multi-millenial scale of dwindling ice sheets and vegetation changes. See Gavin Schimidt, "Why correlations of CO2 and temperature over ice age cycles don’t define climate sensitivity," RealClimate.org, Sept. 24, 2016, online here. Same results by different means: "consilience," discussed more by philosophers of science than by scientists themselves (who take it as a given). BACK
54. A review of ice sheets (which added yet another factor, permafrost thawing beneath a sheet) is Clark et al. (1999). BACK
55. Winograd et al. (1992), p. 255; Ludwig et al. (1992). Pacific currents: Herbert et al. (2001). See also Burns et al. (2011). Moseley et al. (2016), "enigma" p. 168, see reply byWinograd and Coplen (2016). BACK
56."Too complicated:" Karner and Muller (2000). BACK
57. Reviewer: Crowley (2002), p. 1474; see also Wunsch (2004); Drysdale et al. (2009). An attempt at a comprehensive theory: Chang et al. (2009). On the "eccentricity myth:" Maslin and Brierley (2015). BACK
57a. Abe-Ouchi et al. (2013), with historical references to earlier versions of this model. Model (without bedrock rebound) by scraping sediments away: Willeit et al. (2019), see Yehudai et al. (2021). Astronomical: Barker et al. (2025). BACK
58. Shackleton (2000); changes of CO2 preceding changes in ice sheet volume were first reported in Shackleton and Pisias (1985). The feedback is mentioned or assumed in many of the references cited above, e.g., see quote by Genthon; Lorius et al. (1990) remarked that Greenland drilling then underway "should allow a better determination of the relative timing (phase lag) of climate and greenhouse forcing" (p. 145), but the wider community had thought little about a lag. A summary noting some of the complexities is Severinghaus (2009a). CO2 rise came first: Fischer et al. (1999), Shakun et al. (2012). temperature rise first: Caillon et al. (2003). "We find no significant lead/lag:" Parrenin et al. (2013). Bereiter et al. (2018) reported that "mean global ocean temperature is closely correlated with Antarctic temperature and has no lead or lag with atmospheric CO2.". BACK
59. Upwelling: Ai et al. (2020). BACK
copyright © 2003-2025 Spencer Weart & American Institute of Physics