Global mean sea level from tide gauges, as calculated by different research groups with various methods; the black line is from highly accurate satellite measurements. Sea levels rose at the end of the last Ice Age but were roughly stable after 4000 BCE, rising in some places and falling in others due to local geological shifts. A new global rise began in the mid 19th century (see inset) and in the 1980s began to accelerate. The rise was caused partly by the simple thermal expansion of seawater under the influence of global warming, and increasingly by the melting of glaciers and ice sheets. The rate of rise since 1990 has been at least three times the rate before 1950.
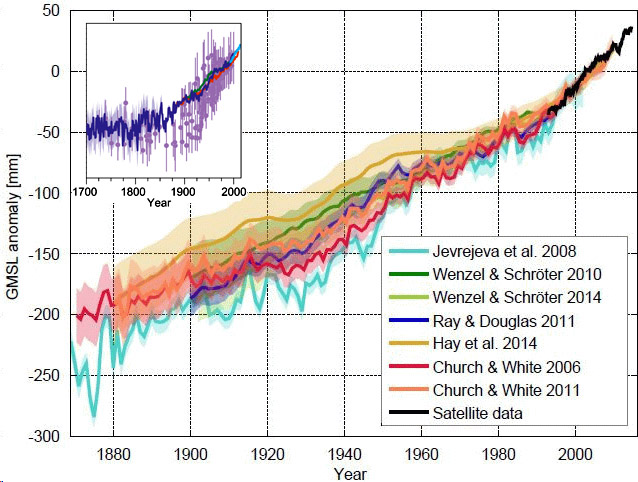
Graph by Klaus Bittermann, see realclimate.org; source: Hay et al. (2015). Inset: IPCC (2014b), p. 1147.