|
After
his famous 1929 paper,
into the 1930s Edwin Hubble continued his campaign to prove the reality
of the velocity-distance relation he had announced. In the 1929 paper,
he remarked that "Mr. Humason at Mount Wilson has initiated a program
of determining velocities of the most distant nebulae that can be observed
with confidence.… New data to be expected in the near future may
modify the significance of the present investigation, or, if confirmatory,
will lead to a solution having many times the weight."
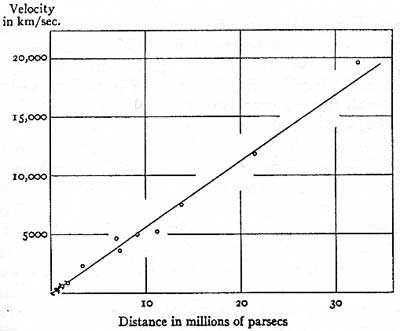
By 1931
Hubble and Humason had velocities for 40 more nebulae, 26 of them in 8
groups of galaxies. The greatest distance was now over a hundred million
light years. This was 50 times farther than the most distant spiral nebulae
in the 1929 report. The linear velocity-distance relation held.

Hubble's
1931 velocity-distance relation. Circles represent mean values for
clusters or groups of nebulae. Dots near the lower-left corner represent
individual nebulae. These and the lowest two circles were used in
the 1929 formulation of the velocity-distance relation. |
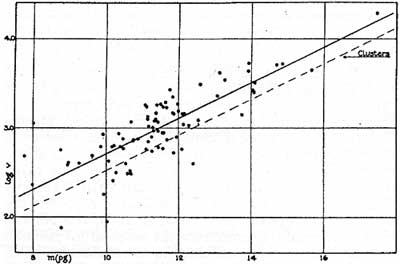
In 1934
Hubble and Humason reported results for isolated nebulae not in clusters.
Still the velocity-distance relation held.

Hubble's
1934 velocity-distance relation. The solid line represents the velocity-distance
relation determined from isolated nebulae. It parallels the velocity-distance
relation earlier determined from nebulae in clusters, represented
by the dashed line. The velocity-distance relation for isolated nebulae
is a magnitude brighter than the relation for nebulae in clusters.
This was attributed to selection effects — the brightest nebulae
were the easiest to find in isolation, whereas less bright nebulae
were found easily in clusters. |
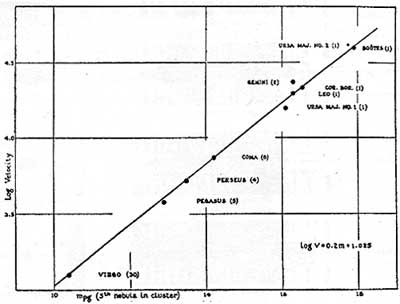
By 1936
Hubble and Humason had data for a hundred more nebulae. The velocity-distance
relation was "still sensibly linear to a distance of 70 million parsecs
[more than 200 million light years]."

Hubble's
1936 velocity-distance relation. Numbers in parentheses following
the names of the clusters indicate the number of nebulae observed
in each cluster. Because the fainter nebulae in the most distant clusters
were below the observing limit of the 100-inch telescope, Humason
plotted, as an indication of distance, the magnitude of the fifth
brightest nebula in each of the clusters. |
|


