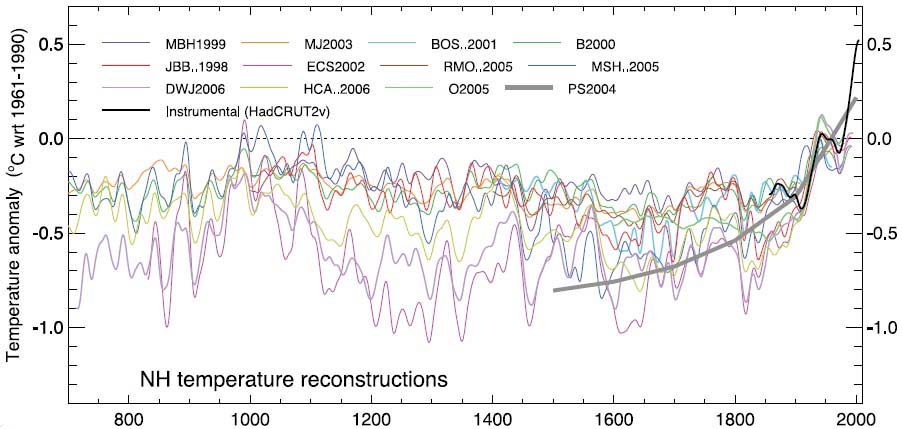
A dozen different attempts to reconstruct Northern Hemisphere temperatures over the last millenium. The black curve that shoots up abruptly in the 20th century is based on data from many thousands of satellite, land and ocean instruments, confirmed by measurements of temperatures down boreholes (the gray curve labeled PS2004). The other curves, drawing upon countless hours of data-gathering and analysis by thousands of people, average a variety of "proxy" data ranging from tree rings to chemicals in coral reefs. The relatively warm period noticeable in the early Medieval period in these curves was apparently not global, for it is not prominent in the more limited data from the Southern Hemisphere and the high Arctic. The curve "MBH 1999" traces the original "hockey stick" curve, attacked by critics as misleading. By 2006 even skeptics agreed with the authors' basic conclusion that "late 20th century warmth is unprecedented." The recent steep rise could only be explained as a consequence of the equally steep rise of greenhouse gas emissions.*
Source: Jansen
et al. (2007), fig. 6.10, p. 467. For more, see their
pdf.
*"Unprecedented:"
Mann and Jones
(2003). "We find no evidence for any earlier periods in the last
two millennia with warmer conditions than the post-1990 period... [computer]
model experiments that use natural-only forcings fail to reproduce this
warming,"according to
Moberg et al. (2005).